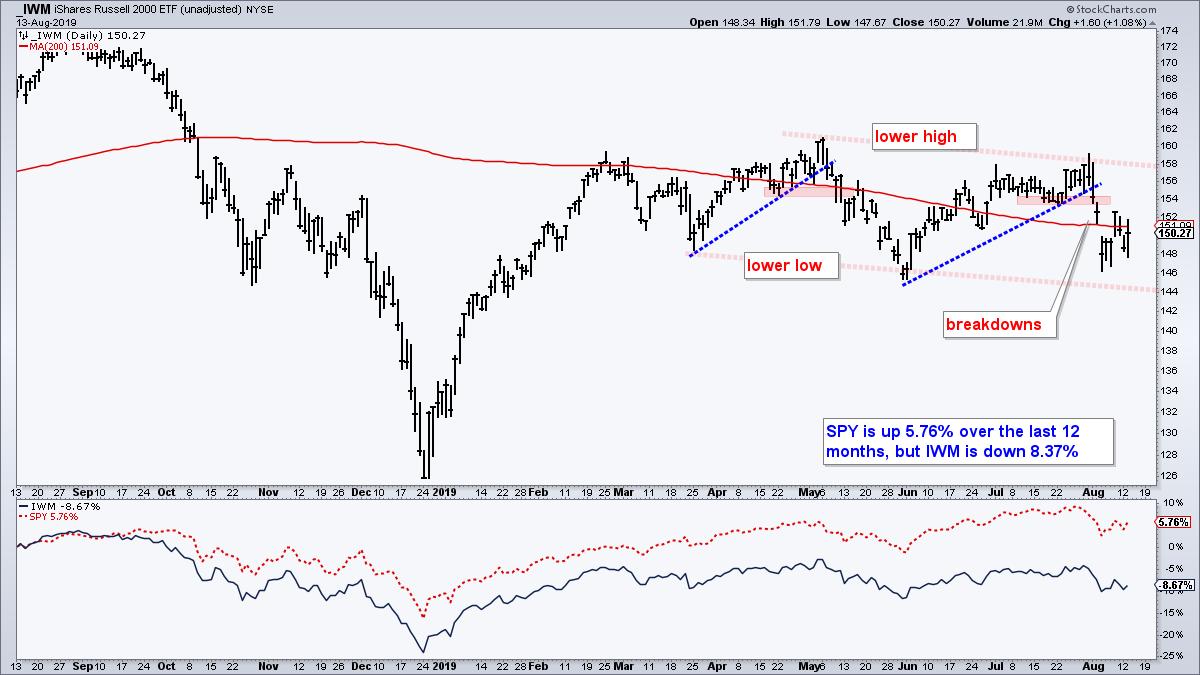
The Russell 2000 iShares (IWM) has been underperforming for some time now and remains the weakest of the major index ETFs. The chart below shows IWM forming a lower high from May to July and a lower low from March to May. Adding a couple of trend lines to these peaks and troughs, we can see a clear downtrend or falling channel since April. More recently, IWM reversed its upswing with a sharp decline and breakdown in early August low.

The indicator window shows price performance for SPY and IWM over the past year. Notice that SPY is up 5.76% since mid August 2018 and IWM is down 8.67%. Small-caps are clearly not the place to be right now.
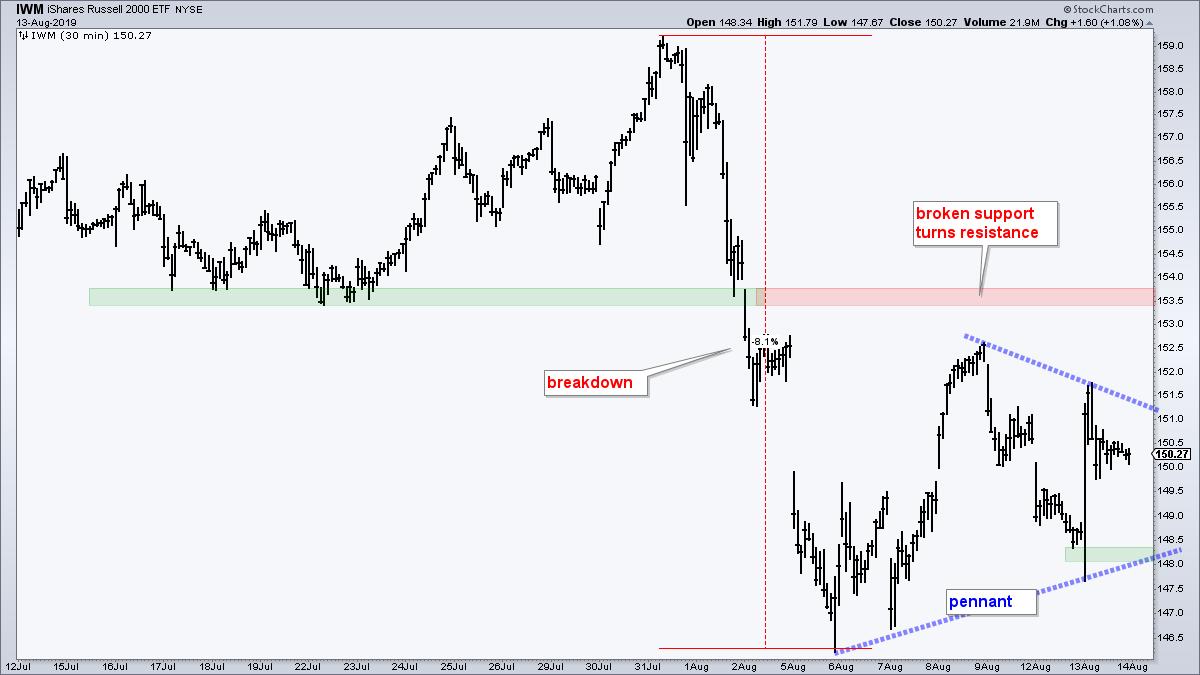
I do not normally use intraday charts, but did notice that a pennant could be taking shape the last six days. IWM fell sharply in early August and broke support in the 153.5-154 area. This broken support zone turns into a resistance zone, but IWM never really challenged the break because the bounce did not exceed 153.

Adding some lines to the consolidation over the last six days, we can see a contraction in price and a pennant consolidation taking shape. These are continuation patterns that depend on the direction of the prior move for their trading bias. Well, the prior move was down and this pennant is a bearish continuation pattern.
A break below 148 would signal a continuation of the prior decline, which was around 8%. An 8% decline from the pennant high (~152.5%) would target a move to the 140 area. A break above 152 would negate this pattern and call for a re-evaluation.
------------------------------------------------------------
Choose a Strategy, Develop a Plan and Follow a Process
Arthur Hill, CMT
Chief Technical Strategist, TrendInvestorPro.com
Author, Define the Trend and Trade the Trend
Want to stay up to date with Arthur's latest market insights?
– Follow @ArthurHill on Twitter


