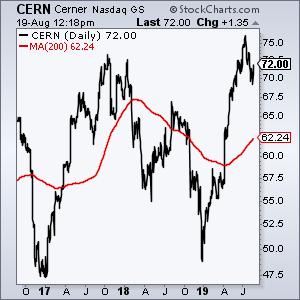
 Some stocks fit nicely into sectors and industry groups. And some don't. Cerner (CERN) is part of the Health Care SPDR (XLV), but it is really a technology stock that serves the healthcare industry. Namely, Cerner provides information technology solutions for the healthcare industry. More importantly, the price chart looks constructive as the stock reverses a short-term pullback to signal a continuation of the long-term uptrend.
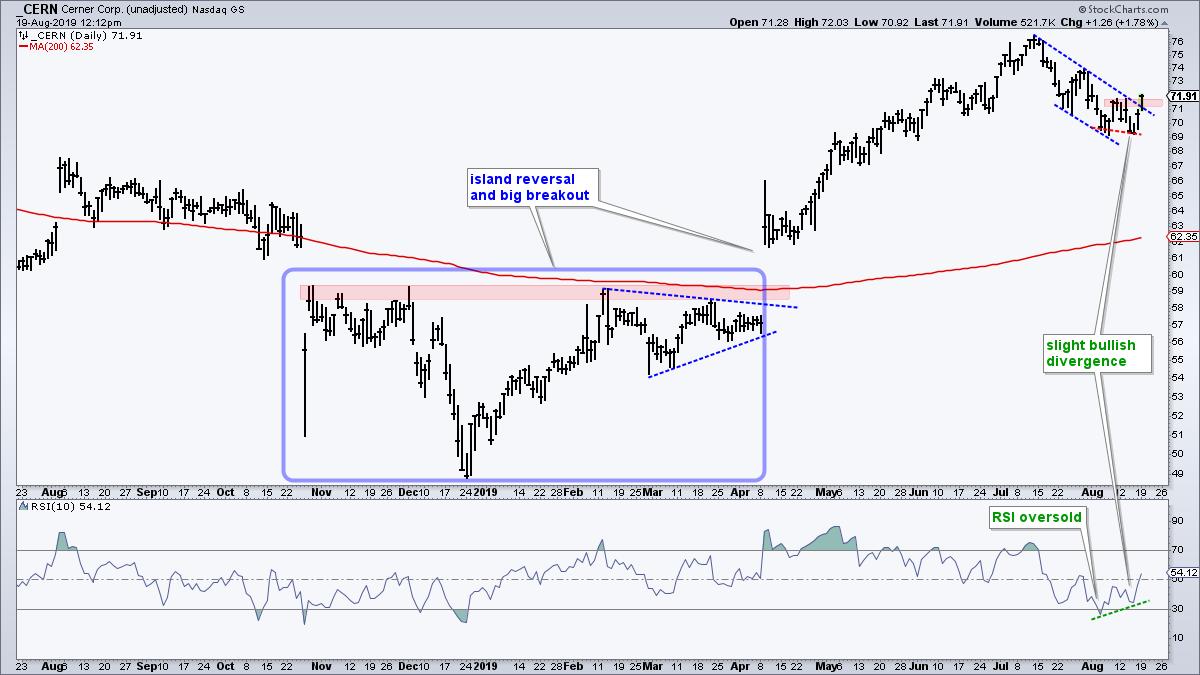
First and foremost, the long-term trend is up. The chart shows Cerner with a big island reversal from November to March and a breakout in April. The stock broke above the 200-day SMA with a big gap and never looked back as it surged to new highs in June and July.
CERN became a bit oversold after a 50% advance in six months. The stock worked off this oversold condition with a decline back to the 69 area and a bullish setup materialized. First, notice that a falling flag formed over the last few weeks. These patterns are typical for corrections within an uptrend.

Second, notice that RSI(10) moved below 30 to become oversold. In addition, RSI formed a small bullish divergence in August. Notice that CERN formed a lower low (closing basis) as RSI forged a higher low (green line). Today's breakout confirms the divergence and argues for a continuation of the bigger uptrend. A close below 70 would warrant a re-evaluation.
Choose a Strategy, Develop a Plan and Follow a Process
Arthur Hill, CMT
Chief Technical Strategist, TrendInvestorPro.com
Author, Define the Trend and Trade the Trend
Want to stay up to date with Arthur's latest market insights?
– Follow @ArthurHill on Twitter


