It has been 1.5 years since the tariff discussion started and the US market is broadly flat. While looking around for clues as to what to do next, I noticed some of the stocks in the Chinese large cap growth names are setting up for a potential breakout.
Alibaba (BABA) has been grinding sideways for the past 1.5 years. This week, BABA surged almost 10% on a bounce off the uptrend line. This was happening all while we had one of the most volatile weeks of the year. For me, it is a setup worth watching. The SCTR ranking is trying to move in the top quartile, which would be very bullish. The relative strength indicator (in purple) is pushing to fresh 3-month highs to close out the week. We can see the full stochastic trying to turn up at the 50% level, which is something we can see at the start of a bullish move.
The price had a large swoon in the second half of 2018. Now, the stock is oscillating with higher lows. A move above $195 would add a higher high to that big picture change. However, the trend line drawn has a touch point at $179 from a few weeks ago. A break above $180 after testing the 40-week moving average looks pretty bullish!
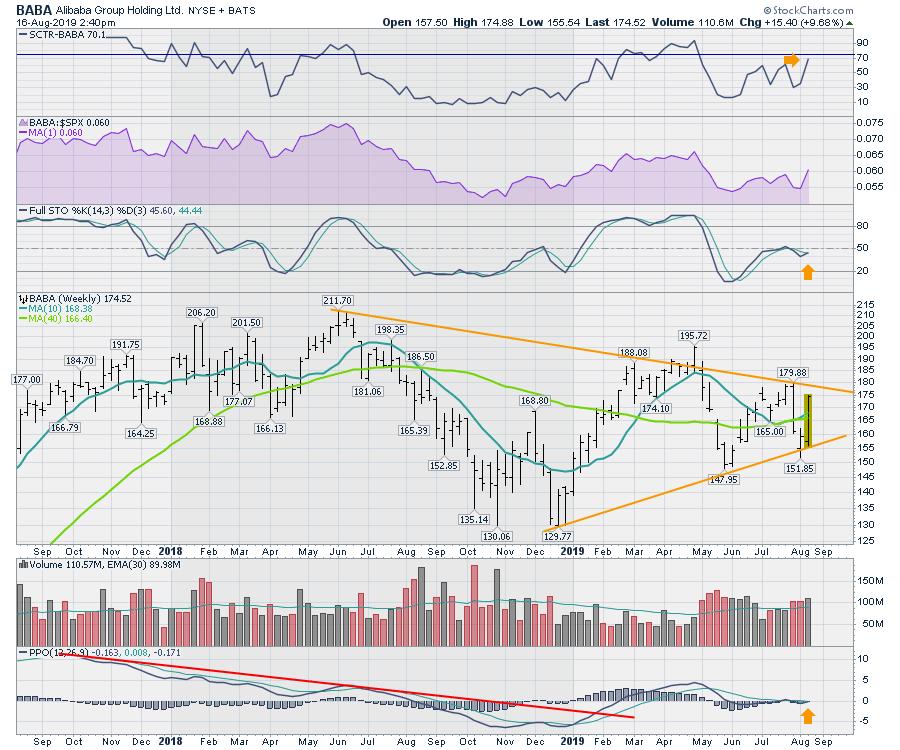
The volume has been strong since May, so the stock has lots of interest.
For me, one of the most important indicators is the momentum indicator. I use the PPO for momentum, and in January the PPO broke a major downtrend in momentum. After oscillating higher, the PPO has since pulled back to the zero level. If it can start to soar after a bounce off zero, that would set up nicely for a big long-term rally.
I noticed the Shanghai index also performed particularly well this week. One week doesn't make a trend change, but, while the US markets had a wide-ranging week, the Shanghai had an inside week. All that is to say that these Chinese stocks might be setting up!
Good trading,
Greg Schnell, CMT, MFTA
Senior Technical Analyst, StockCharts.com
Author, Stock Charts For Dummies
Want to stay on top of the market's latest intermarket signals?
– Follow @SchnellInvestor on Twitter
– Connect with Greg on LinkedIn
– Subscribe to The Canadian Technician
– Email at info@gregschnell.com


