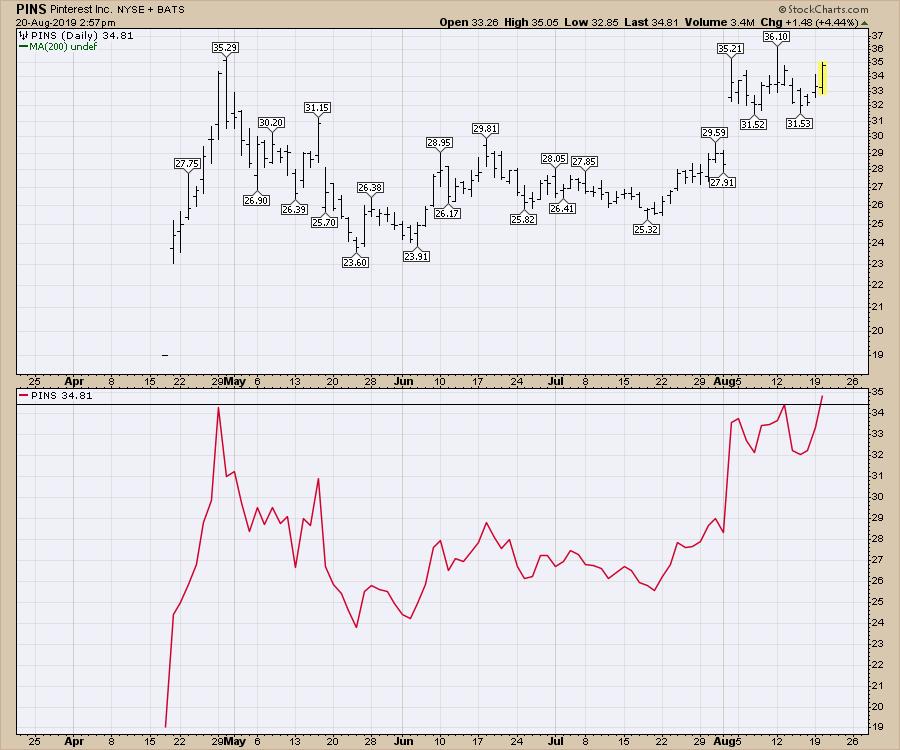
One thing about a wild ride in the indexes - it makes the breakout names so much more difficult to trade expecting followthrough. This week, one of the high-profile IPO names is breaking out to fresh highs. A close on Tuesday above $34.42 would make it the highest close.

Through all of the market volatility that has ensued since August 1, Pinterest (PINS) has traded in a tight range and looks set to break out above the prior highs. The bar chart obscures where the highest close is, but you can use a line chart to define that change.
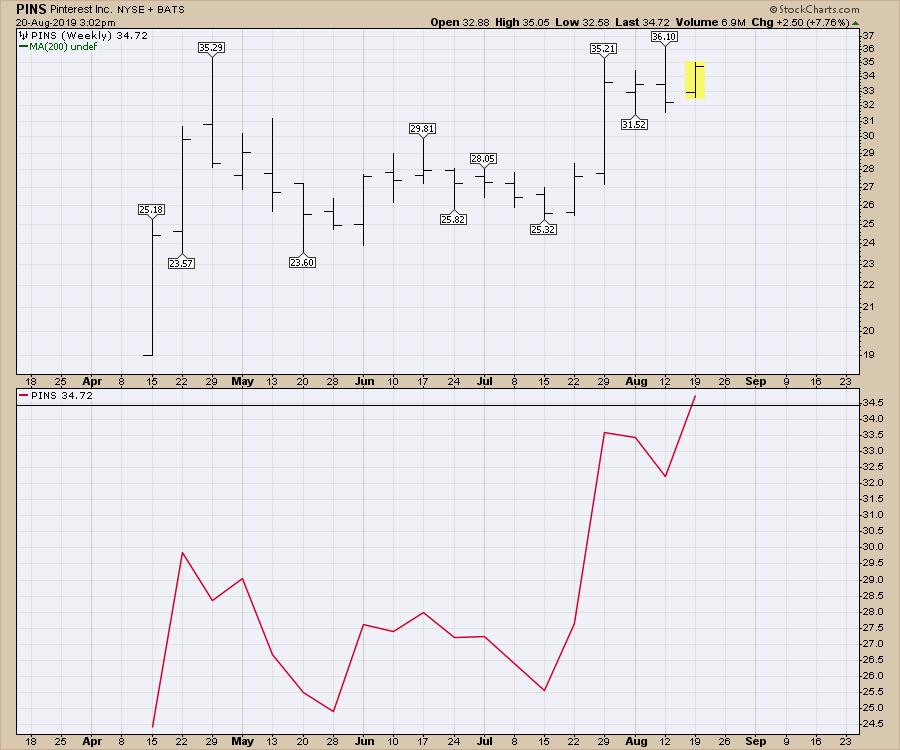
With a nice base built after the IPO, Pinterest looks like it has support at $32 and is ready to move to higher ground. Changing the chart display can help you find closing prices rather than intraday highs. When using weekly or monthly charts, you will only see the Friday close on weekly or the final trading day on the monthly, so be aware of the differences as you switch through time horizons.
As an example, PINS cleared the highest weekly close above the base in July. The chart below shows how different weekly data appears when displayed in different forms.

I like the setup here. A stop below $32 should keep you in the stock should we continue to see more volatility.
Good trading,
Greg Schnell, CMT, MFTA
Senior Technical Analyst, StockCharts.com
Author, Stock Charts For Dummies
Want to stay on top of the market's latest intermarket signals?
– Follow @SchnellInvestor on Twitter
– Connect with Greg on LinkedIn
– Subscribe to The Canadian Technician
– Email at info@gregschnell.com


