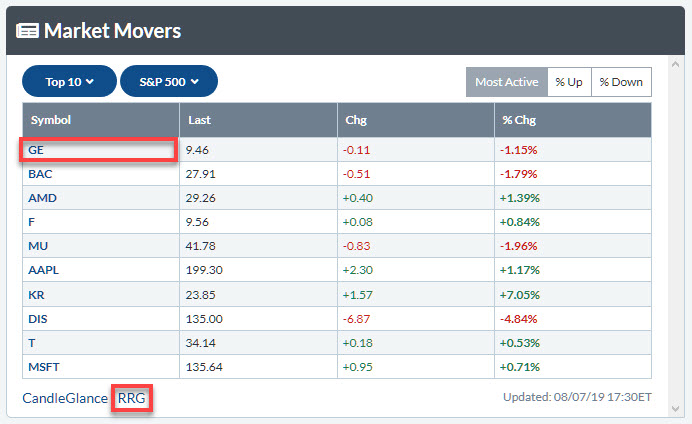
A good way for you to check what has been driving a particular market is to go to the "Market Movers" widget on your dashboard and select the universe that you are interested in.

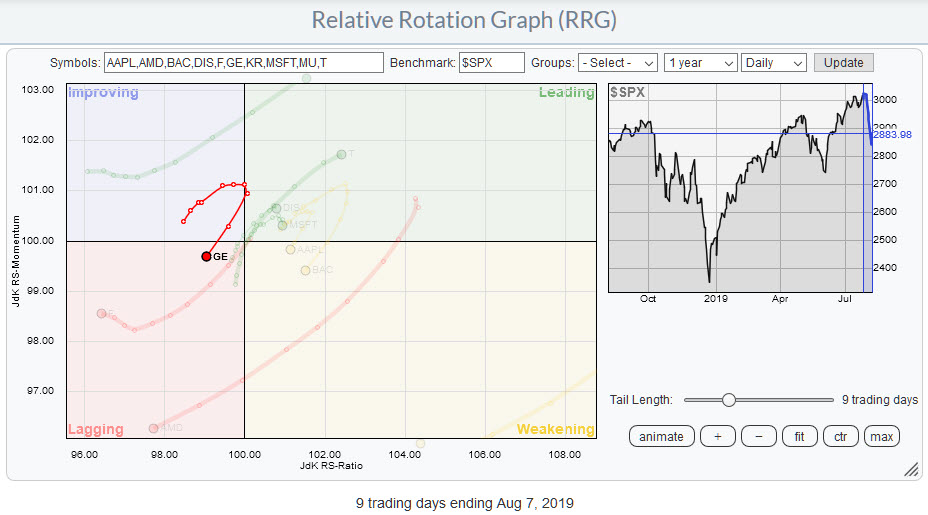
To the right, I have printed the table showing the top 10 most active stocks in the S&P 500. Running a Relative Rotation Graph for this group can be done by simply clicking the link below the table. This will give you an overview of the most important market movers. That RRG is shown at the top of this article.

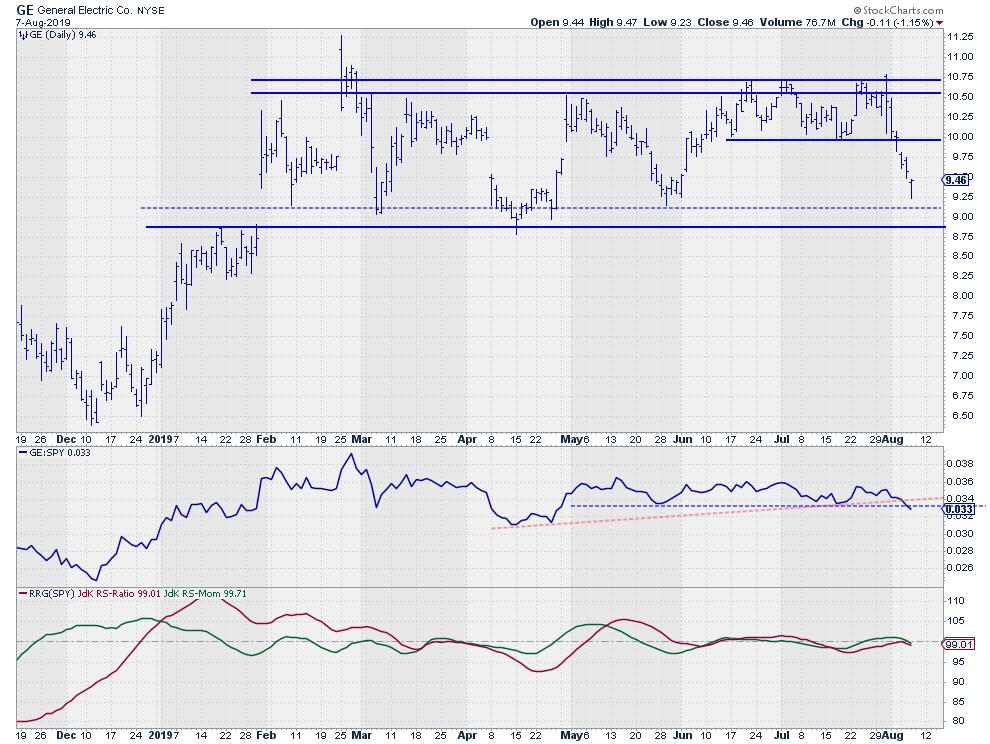
One rotation that immediately had my attention was the tail for General Electric (GE). This stock has been trying very hard to break above that $10.50-10.75 barrier since February but has failed every time. In July, there were three attempts, but the stock never did manage to clear that overhead resistance.
The recent break below intermediate support at $10 has triggered an acceleration downward, which is now pushing GE down to the lower boundary of the trading range. Support may now be expected around $9.00.
The RS-Line is sending weak signals as it breaks a slightly up-sloping trend line connecting three lows since April. It is also breaking the horizontal support level coming from lows in May and July. This has caused the tail for GE on the RRG to roll over inside the improving quadrant, without hitting leading, a move that generally points to more (relative) weakness.
My regular blog is the RRG Charts blog. If you would like to receive a notification when a new article is published there, simply "Subscribe" with your email address.
Julius de Kempenaer
Senior Technical Analyst, StockCharts.com
Creator, Relative Rotation Graphs
Founder, RRG Research
Want to stay up to date with the latest market insights from Julius?
– Follow @RRGResearch on Twitter
– Like RRG Research on Facebook
– Follow RRG Research on LinkedIn
– Subscribe to the RRG Charts blog on StockCharts
Feedback, comments or questions are welcome at Juliusdk@stockcharts.com. I cannot promise to respond to each and every message, but I will certainly read them and, where reasonably possible, use the feedback and comments or answer questions.
To discuss RRG with me on S.C.A.N., tag me using the handle Julius_RRG.
RRG, Relative Rotation Graphs, JdK RS-Ratio, and JdK RS-Momentum are registered trademarks of RRG Research.
Julius de Kempenaer
Senior Technical Analyst, StockCharts.com
Creator, Relative Rotation Graphs
Founder, RRG Research
Host of: Sector Spotlight
Please find my handles for social media channels under the Bio below.
Feedback, comments or questions are welcome at Juliusdk@stockcharts.com. I cannot promise to respond to each and every message, but I will certainly read them and, where reasonably possible, use the feedback and comments or answer questions.
To discuss RRG with me on S.C.A.N., tag me using the handle Julius_RRG.
RRG, Relative Rotation Graphs, JdK RS-Ratio, and JdK RS-Momentum are registered trademarks of RRG Research.


