After such a sudden swing down, who would be surprised if we whipped sideways for a bit? With the 1000-point move down and back up on the $INDU over the past few days, would anyone be shocked that the next direction is difficult? We have lots of reasons to be concerned. If you have followed my market review videos over the last 4 weeks, you might have been expecting a drop. Now, however, it gets harder.
As the market changes from a healthy view to a hangover, I am watching to see some industry groups rise to the top. The width of the market river has narrowed significantly. Stocks like ROKU reported earnings on the bounce-back day and made a moon shot higher. Stocks like Shake Shack (SHAK) went ballistic, and it looks like the long-term breakout will hold.
There does seem to be a particular pattern to what has been breaking out - the closer to the domestic situation, the better. Exporters seem to be getting hit hard, but companies that are solely domestic are getting bought. Buyers are buying American-based revenue! Rather than showing some charts that are already soaring, today presents a stock that is setting up.
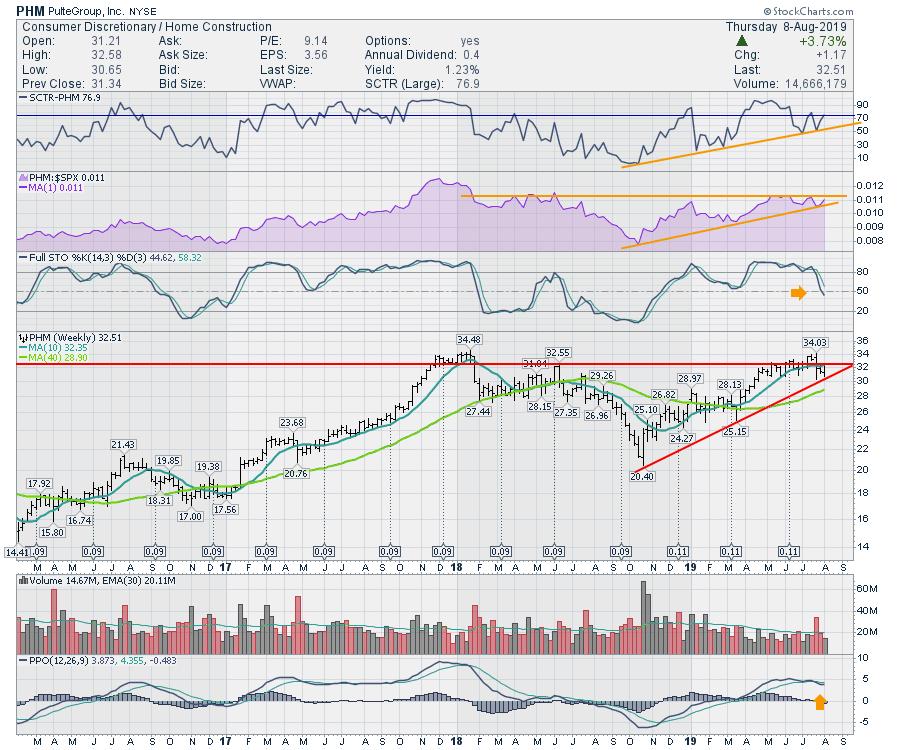
One industry group chart that looks ok is the Home Construction industry. Within that industry, Pulte Group (PHM) looks to be setting up for a move higher. While it is still before the breakout, it seems PHM is a stock to watch. It is also set up so that a stop could be placed just below the entry to protect against downside.

First of all, the SCTR continues to make higher lows and has held up well during the recent selling. The purple area shows relative strength compared to the $SPX. We would like to see this stock make new 52-week highs in relative strength and price. The full stochastic is pulling back to the 50 level. A bounce on the full stochastic here could be a nice bull signal. Other examples are the April 2018 bounce and the May 2017 bounce. The momentum indicator, that being the percentage price oscillator (PPO), is still at a very high level, but has rolled over slightly.
From a bearish perspective, I would suggest that any sort of weakness here would be a clear signal to stay away. Notice how the stock behaves when the full stochastic stays below 50. The momentum is rolling over, so that could indicate a place to avoid.
I like the risk-reward balance, but this trade needs a tight stop. A break below $30 would be a definite avoid.
To answer the question in the title, "Where is the hiding spot?", I would suggest that companies with domestic revenue streams look stronger. It is a constantly changing environment, though, and different perspectives can help.
Lastly, the audience for the Canadian Technician market review continues to ramp up. Are you missing the video? These are the headlines we had as we moved towards this recent market pullback:
- New Highs Are Bullish
- New Highs Continue
- A Warning Shot
- Trapped in A Bull Market
- Bulls Leave The Ranch
If you are looking for some unique perspectives on this market, I would encourage you to tune in. The video is produced on the weekend for your viewing heading into Monday. Here is a link to the August 3, 2019 review.
Good trading,
Greg Schnell, CMT, MFTA
Senior Technical Analyst, StockCharts.com
Author, Stock Charts For Dummies
Want to stay on top of the market's latest intermarket signals?
– Follow @SchnellInvestor on Twitter
– Connect with Greg on LinkedIn
– Subscribe to The Canadian Technician
– Email at info@gregschnell.com


