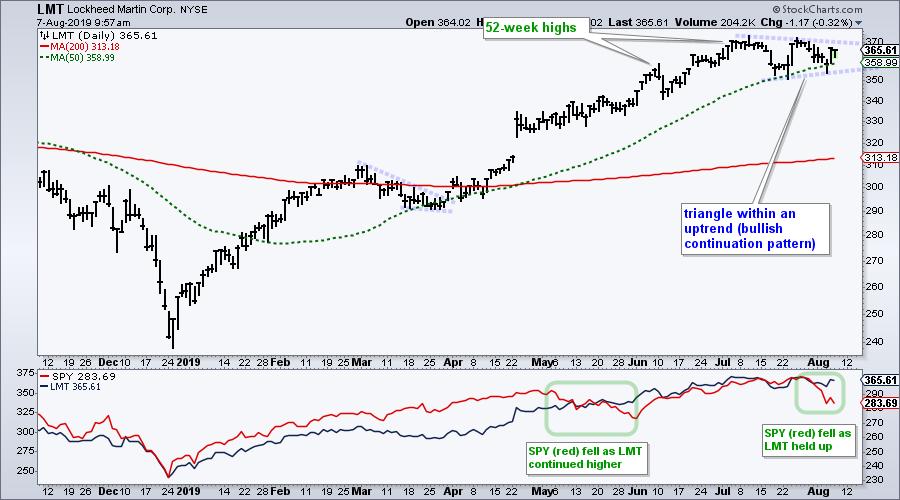
 Stocks were hit hard in August with the S&P 500 SPDR (SPY) moving below its 50-day line and mid July lows. Stocks and ETFs that did not break their 50-day lines and held above their mid July lows are showing relative "chart" strength. Lockheed Martin (LMT) is one such stock and a bullish continuation pattern is forming.
First and foremost, LMT is in a long-term uptrend. The stock is well above its 200-day SMA and the 50-day SMA is well above the 200-day SMA. Furthermore, the stock recorded 52-week highs in June and July. After hitting a new high in July, the stock moved into a small consolidation that looks like a triangle. A consolidation within an uptrend is typically a bullish continuation pattern and an upside breakout would open the door to further gains.

The indicator windows shows SPY in red and LMT in black. Notice how SPY fell in May and LMT continued to move higher. This signaled relative and absolute strength. Looking at the last two weeks, SPY fell to its lowest level since early June and LMT held the mid July low. Again, LMT held up better than SPY and this shows relative strength.
--------------------------------------------------------------
Choose a Strategy, Develop a Plan and Follow a Process
Arthur Hill, CMT
Chief Technical Strategist, TrendInvestorPro.com
Author, Define the Trend and Trade the Trend
Want to stay up to date with Arthur's latest market insights?
– Follow @ArthurHill on Twitter


