On the Relative Rotation Graph for technology stocks, LRCX stands out, with its relatively long tail and its push into the leading quadrant at a strong RRG-Heading. Such a rotation is more than enough reason to open up a regular chart for further investigation.
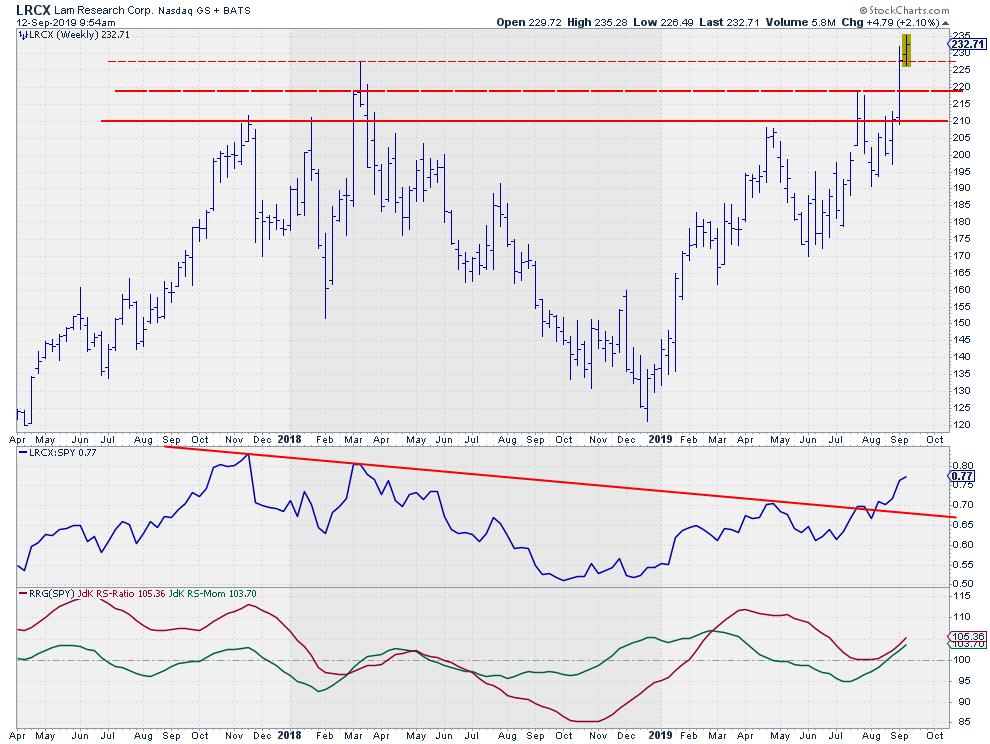
The chart above shows LRCX on a weekly scale with relative strength and the RRG-Lines. The number one clue signaling further upside for LRCX is the break to new highs. Last week's jump closed 20 cents above the March high at $227.70 (short dashes) and solidly above the (IMHO) more reliable resistance level just below $220 (long dashes). This week, with two more trading sessions to go, LRCX is continuing higher.
The price action of the last two weeks brought the RS-Line above its falling resistance as it started to move higher, with a new series of higher highs and higher lows emerging in relative strength. The resulting RRG-Lines are now moving higher in tandem after RS-Ratio dipped at the 100-level and started to move higher again.
All in all, the combination of a break to new highs with improving relative strength make this a stock worth watching.
My regular blog is the RRG Charts blog. If you would like to receive a notification when a new article is published there, simply "Subscribe" with your email address.
Julius de Kempenaer
Senior Technical Analyst, StockCharts.com
Creator, Relative Rotation Graphs
Founder, RRG Research
Want to stay up to date with the latest market insights from Julius?
– Follow @RRGResearch on Twitter
– Like RRG Research on Facebook
– Follow RRG Research on LinkedIn
– Subscribe to the RRG Charts blog on StockCharts
Feedback, comments or questions are welcome at Juliusdk@stockcharts.com. I cannot promise to respond to each and every message, but I will certainly read them and, where reasonably possible, use the feedback and comments or answer questions.
To discuss RRG with me on S.C.A.N., tag me using the handle Julius_RRG.
RRG, Relative Rotation Graphs, JdK RS-Ratio, and JdK RS-Momentum are registered trademarks of RRG Research.
Julius de Kempenaer
Senior Technical Analyst, StockCharts.com
Creator, Relative Rotation Graphs
Founder, RRG Research
Host of: Sector Spotlight
Please find my handles for social media channels under the Bio below.
Feedback, comments or questions are welcome at Juliusdk@stockcharts.com. I cannot promise to respond to each and every message, but I will certainly read them and, where reasonably possible, use the feedback and comments or answer questions.
To discuss RRG with me on S.C.A.N., tag me using the handle Julius_RRG.
RRG, Relative Rotation Graphs, JdK RS-Ratio, and JdK RS-Momentum are registered trademarks of RRG Research.


