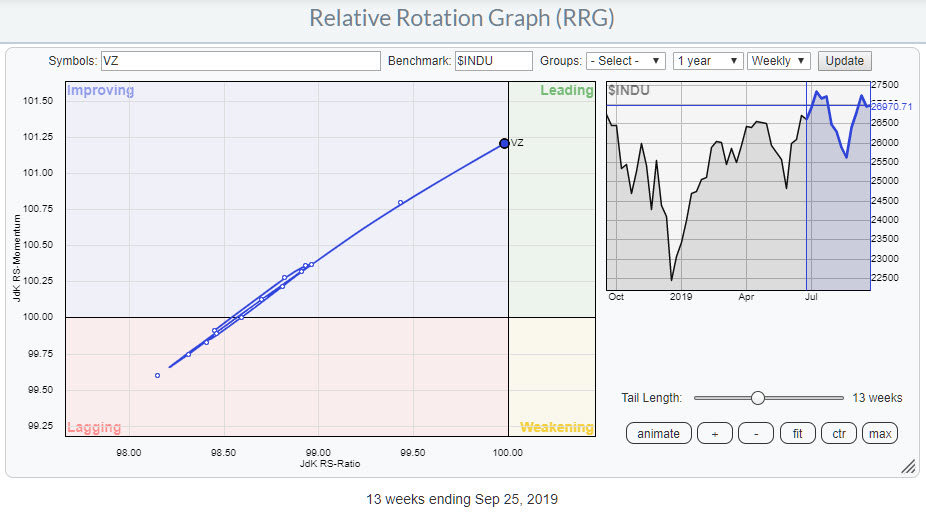
On the weekly Relative Rotation Graph holding the Dow 30 stocks, we can see Verizon (VZ) shooting from the improving quadrant towards leading.
The RRG below shows VZ in isolation. It is hard to see as the move went very fast, but, since mid-July, VZ has completed a rotation from lagging into improving, then back into lagging and into improving again.
Over the past 3-4 weeks, the tail on VZ started to get longer. The RRG-Heading remains strong (almost 45 degrees) and VZ is now about to cross over into the leading quadrant.
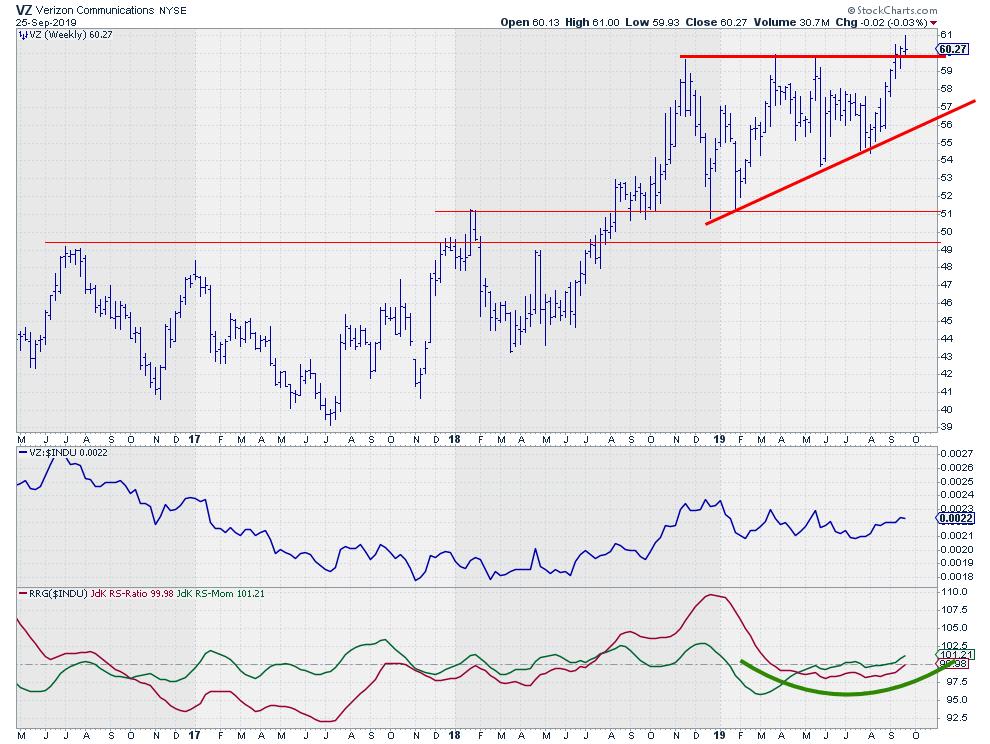
In particular, when we bring the price chart of VZ (as seen at the top of this article) into the equation, VZ really becomes a stock to watch.
At the end of 2018, a high was formed just below $60. That level was tested again twice in the first six months of 2019, creating a strong horizontal resistance level. The opposing lows over that period of time all came in at higher levels, creating an ascending triangle which usually resolves to the upside.
Buyers are willing to get in at higher prices, as indicated by the higher lows, while sellers continue to provide supply at the horizontal level. When supply dries up and demand continues to come, that resistance level is broken and prices usually continue higher.
At the moment, that triangle is in the process of being broken to the upside, signaling a strong possibility for a further rise in prices for VZ.
It is likely further improvement of relative strength will be a result as well.
-Julius
My regular blog is the RRG Charts blog. If you would like to receive a notification when a new article is published there, simply "Subscribe" with your email address.
Julius de Kempenaer
Senior Technical Analyst, StockCharts.com
Creator, Relative Rotation Graphs
Founder, RRG Research
Want to stay up to date with the latest market insights from Julius?
– Follow @RRGResearch on Twitter
– Like RRG Research on Facebook
– Follow RRG Research on LinkedIn
– Subscribe to the RRG Charts blog on StockCharts
Feedback, comments or questions are welcome at Juliusdk@stockcharts.com. I cannot promise to respond to each and every message, but I will certainly read them and, where reasonably possible, use the feedback and comments or answer questions.
To discuss RRG with me on S.C.A.N., tag me using the handle Julius_RRG.
RRG, Relative Rotation Graphs, JdK RS-Ratio, and JdK RS-Momentum are registered trademarks of RRG Research.
Julius de Kempenaer
Senior Technical Analyst, StockCharts.com
Creator, Relative Rotation Graphs
Founder, RRG Research
Host of: Sector Spotlight
Please find my handles for social media channels under the Bio below.
Feedback, comments or questions are welcome at Juliusdk@stockcharts.com. I cannot promise to respond to each and every message, but I will certainly read them and, where reasonably possible, use the feedback and comments or answer questions.
To discuss RRG with me on S.C.A.N., tag me using the handle Julius_RRG.
RRG, Relative Rotation Graphs, JdK RS-Ratio, and JdK RS-Momentum are registered trademarks of RRG Research.


