The legalization of marijuana in Canada has led to more than 100 companies racing into the marijuana space to mark out their niche. Investors and companies enthusiastically philosophized about the riches to come after Canada's Prime Minister set the date for legalization. October 17, 2018 became known as Weed Wednesday in Canada.
Let me diverge a bit and then come back to the marijuana space.
This article is going to be a little bit about history repeating itself and a little bit about the future. Over and over again, we have seen new investing strategies that soared and then collapsed; fuel cells, internet companies in the 90's, solar energy, Chinese software companies and Bitcoin, to name a few. I learned one of my many lessons related to investing on the fuel cell business. I owned a stock, Global Thermoelectric, that was making wonderful new products that would create power from ceramic systems. Its peak was $45 and my broker finally talked me into selling the stock at $9.
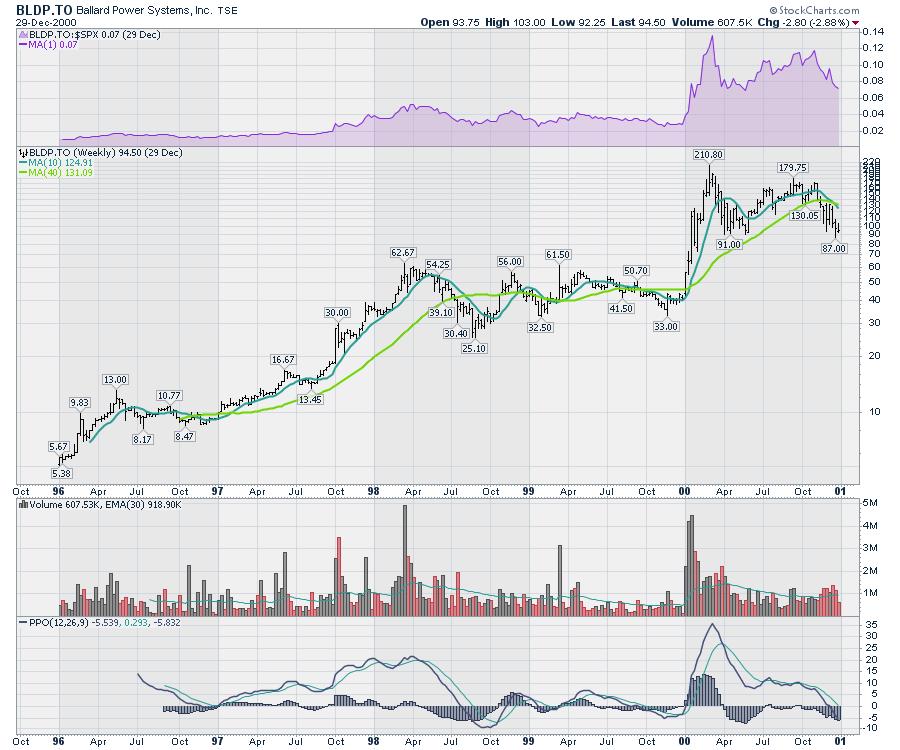
At the time, I had not studied technical analysis. I went to the company's local head office and got little if any new news, but they gave me a coffee cup that resides in my cabin cupboard today. If I remember correctly, it was the late 1990s/early 2000s when fuel cells were all the rage. The original Global ThermoElectric is private now, so a quick look at Ballard Power (BLDP, BLDP.TO) can show you what the fuel cell charts looked like heading into the century changeover. This was not internet-related, but it was another investing theme at the time.
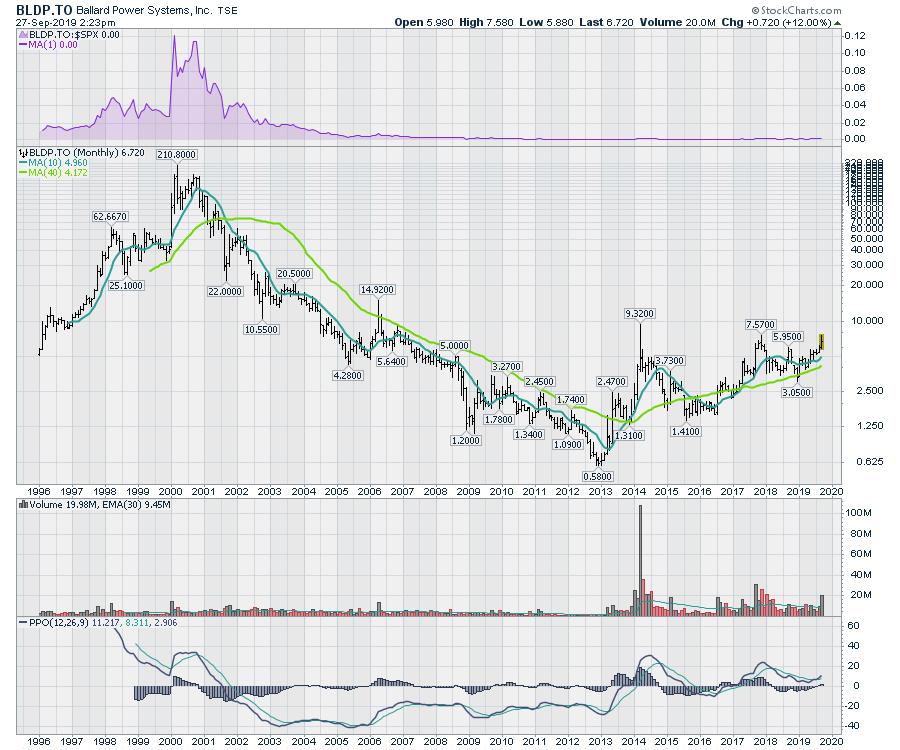
Let me show you how that worked out by switching to a monthly chart. While Ballard Power was the leader in the space, I assumed my choice would be equally as wonderful. Ballard's stock chart recently has seen some meaningful volume changes and the price is back above the IPO price of 1995. Woohoo!
The Global ThermoElectric company has been through a few iterations, but still exists under another private name. GenTherm Global Power. Visiting their website, I could not help but chuckle. They have a picture with a plugin sticking out of a snowbank on their home page. You just have to click on the link and check out the pictures on the homepage.
As a matter of fact, I could have bought Google instead, which I also have a coffee cup from. This gap in net worth is probably obvious to most readers. But both were new companies. Some will thrive, some will not. I could have bought Yahoo too. We are never quite sure which one is going to be the winner.
Let's get back to marijuana-related investing. The chart below is the Horizons Medical Marijuana ETF (HMMJ.TO), listed in Canada. (Twitter has decided that HMMJ stands for "Hand Me My Joint," which I found to be both pretty funny and quite helpful in remembering the ticker symbol.) This ETF holds a group of marijuana companies. Let's call it the average or the proxy for the industry.
As we headed into Weed Wednesday in October 2018, we were hosting a Canadian Technicians Day in Calgary the weekend before (Saturday October 13th, 2018). During the panel discussion, I mentioned that it was probably the highest-risk day for investing in Marijuana. Would the hype ever be higher? Craig Johnson, Chief Technical Director at Piper Jaffray was on the panel with me, along with Cory Mitchell, another Calgary-based CMT. We all agreed that this could be an important interim high as we were at or near the maximum public euphoria level.
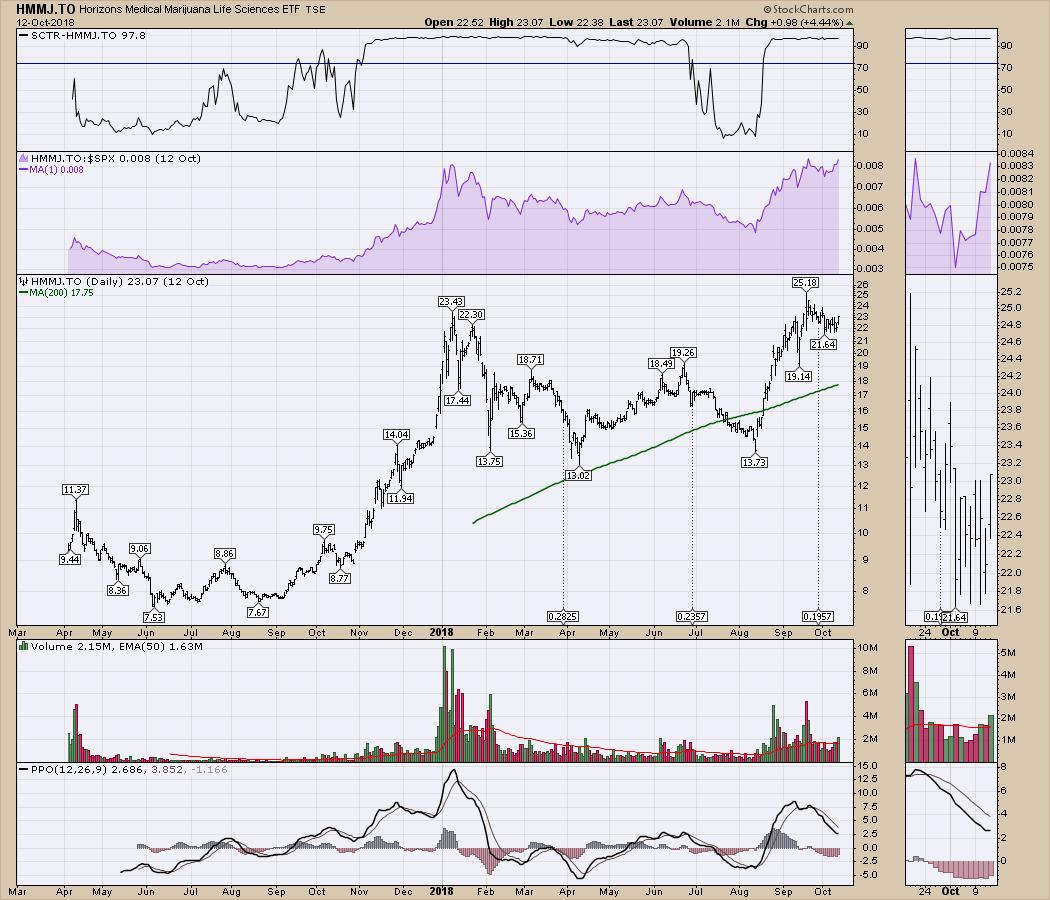
Here is the chart on the Friday before our Technician's Day. Bullish! What's not to like? The SCTR ranking is pinned at 97%, suggesting this ETF is better than 97% of the stocks and ETFs on the Canadian Exchange. Relative strength in purple was at or near all-time highs. The $SPX was also pulling back in October 2018, so this ETF was holding up better than the $SPX falling away.
With that as a backdrop, what could go wrong? I wrote a paper for the Dow Jones Award about watching a marijuana trading room in action. The euphoria was bubbly. Everyone was expecting everything to go to the moon. I do not want to disrespect any of the people in the room who were trend following; it was working! One problem was that they all wanted to stay invested if the market pulled back, as this would be just a hiccup on the way to riches.
Some technical issues were already visible on the chart. Notably, it was trying to take out prior highs in euphoria which occurred as the government was announcing the date of legalization. Any time a chart is at a prior high, it is helpful to watch the price action. A failing chart at prior highs can be meaningful. This chart was no exception.
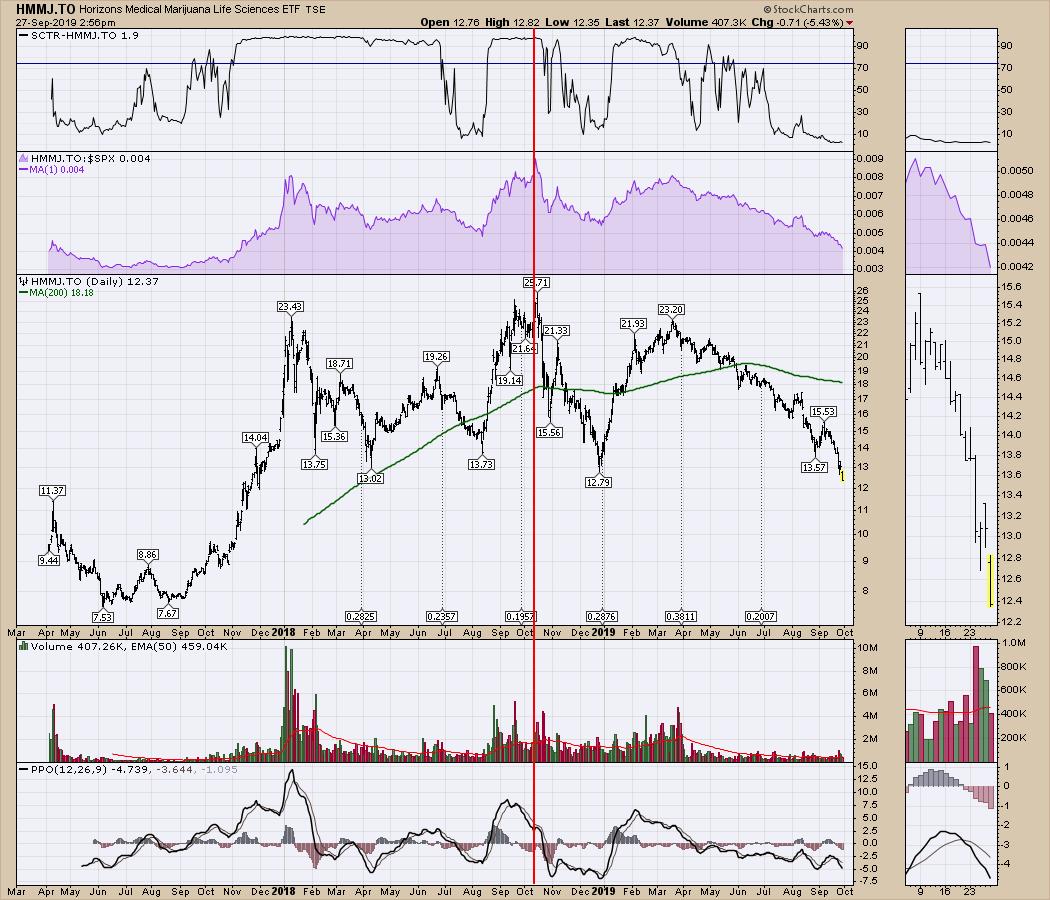
Here is the chart almost a year later. The market sold off immediately and stocks dropped 50% into the December low. The move down in the marijuana industry was assisted by a falling broader market.
The stunning rally off the lows rejuvenated the industry as investors were on board for the next leg up. But once again, it stalled at the prior highs. When someone suggests there is no such thing as a triple top, this is a good chart to roll out.
For new investors who might have been in high school at the time, or new college investors who might have seen the hype, write this one down so you only have to live through it once. For those older investors that are somewhat new to managing their investments, this one is a good reminder.
What are the things we can look for to help with the exit during euphoric moments? This trade might be like the Ballard Power chart above and come back to an uptrend at some point. So we're not saying these are dead forever, but most of the current holders of the stocks are in losing positions. I like the weekly chart as it is cleaner than the daily chart.
One method of selling or reducing positions is when relative strength trends are broken (red lines on the purple area chart). Notice the short red lines showing the end of each euphoric move. What would have been tricky for me, was the break of the long red trend line in December, as I would have thought the whole trade was over then. Apparently there can always be another rally. It has to break the down trend in relative strength to start getting interested in the stock again.
Another selling clue is when the long red trend line on the purple area breaks. You just want out as relative strength is losing steam. If it is a great new industry, it should not be underperforming the $SPX.
We also had lower highs on the PPO, with each wave suggesting waning momentum. I like to use dips below zero and the following rally as a suggestion that the next run might be the last high for a while. It doesn't always work, but it is definitely worth noting on your chart that the momentum got so weak that it went negative for a period of time. This suggests to me that the next rally will probably be weaker. In this case, that played out.
I do have to comment about the volume. Partway through this chart, StockCharts switched data providers and the new provider did not capture all the exchanges trading the ETF, so it is showing a major change in interest on the final high. While the change in interest was real, it might not have been to this extent.
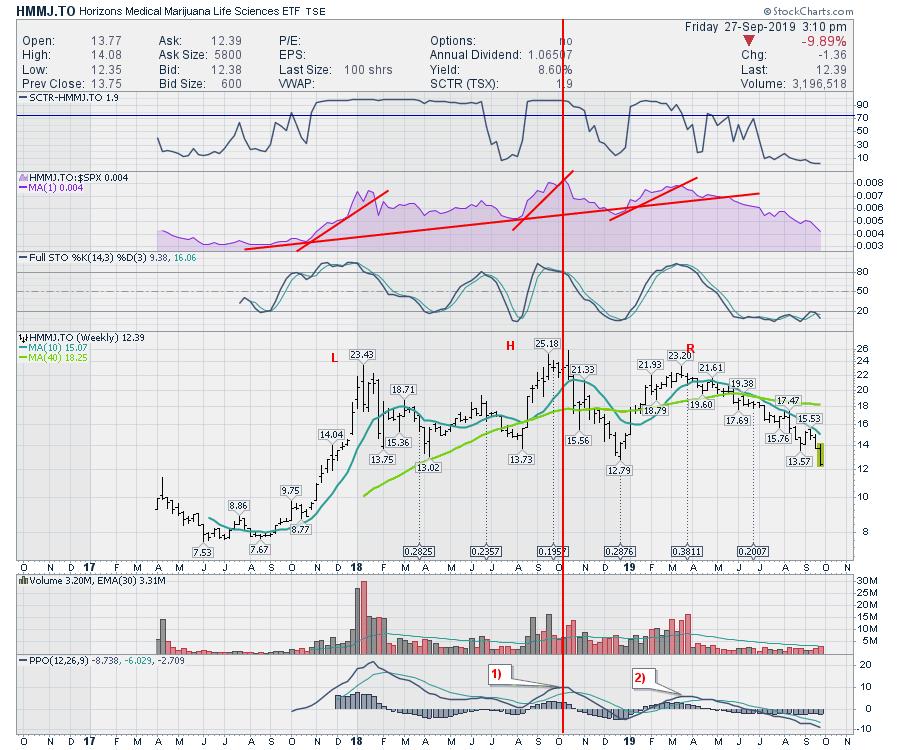
One of the major clues we have is that any stock should be outperforming the $SPX, or else it is not worth the risk. In the case of the marijuana names, they were unprofitable, so they were trading on future news. The purple area chart on my stock chart needs to be rising on the weekly chart to show outperformance. It is a minimum requirement - not just in new themes, but in stocks in general - that you want to see them outperform the averages like the S&P 500.
For traders, you can use other indicators like the full stochastic to help you avoid trouble. It's harder than the indicator looks in hindsight because it uses the weekly close to lock in the chart values, not the intra-week swings.
To end this article about trading new industries, I think it is valuable to attach some of the more prominent names in the space to document how they each rolled over at separate times, which is also hard for the investor to discern if the stock they are in is also going to fail, as it keeps holding up while others fall away. I'll use the Canadian signals so they are all in the same currency, as some have not listed in the USA. (The charts look very similar on the US Exchanges.)
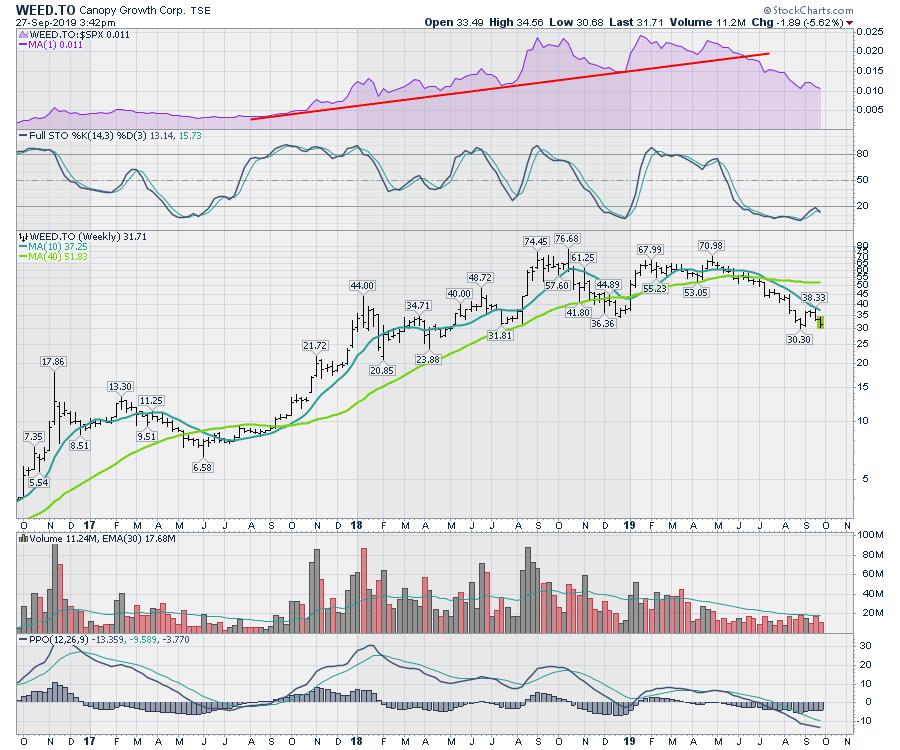
Here is Canopy Growth Corp (WEED.TO). When the big trend in relative strength broke, it was time to go, whether you traded the short cycles or not. Notice the momentum on the PPO rolling over lower and lower. All of these rallies were places to draw in investors, but then they ran out of new buyers and rolled over. While they are trending down, it can be good to watch them, but you need to see the trend reverse to get on board. I was starting to get interested a few times, but then they just rolled over and failed.
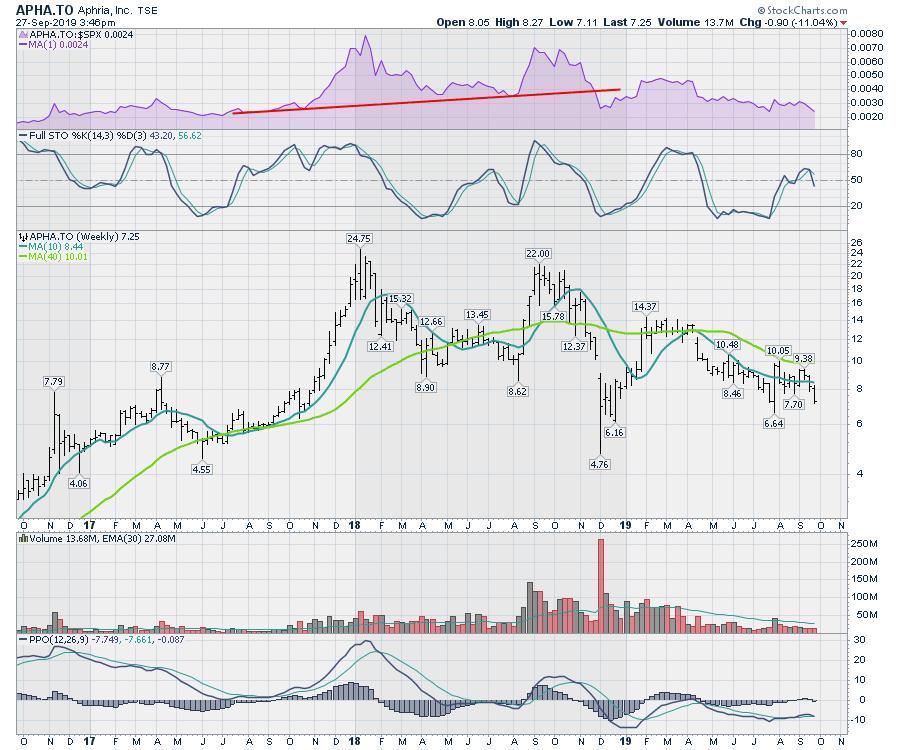
Here's Aphria (APHA.TO). This chart was extremely volatile and made a lower high on Weed Wednesday. The PPO momentum is currently trying to hold near the previous low, but the chart still looks weak. If it starts to improve, then you could look at it, but there is no reason to buy quickly on these big down trends.
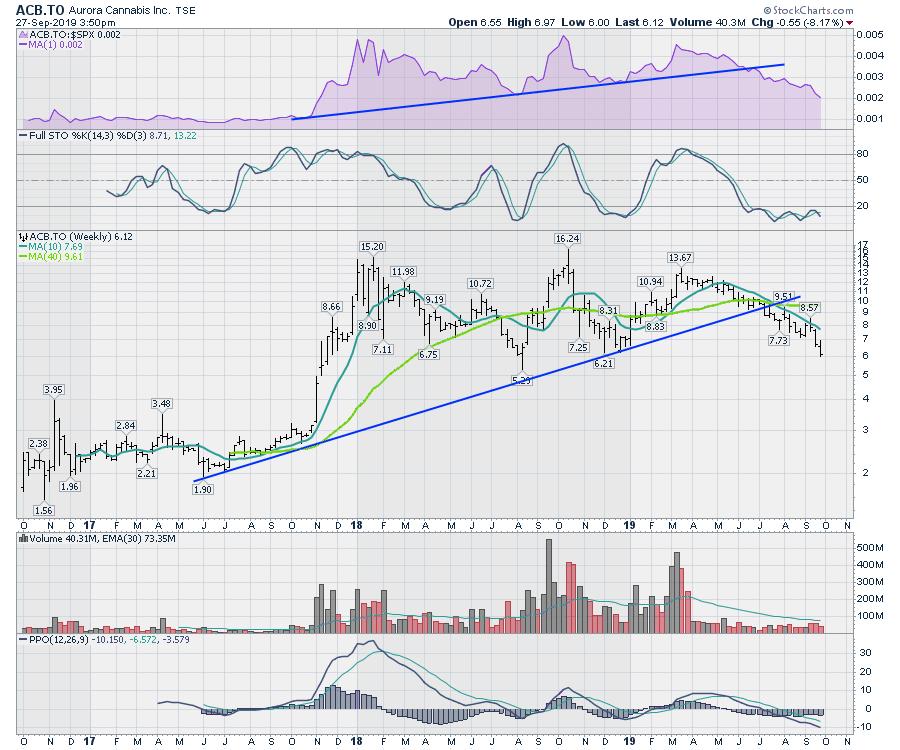
Aurora Cannabis (ACB.TO) continues to break lower. Notice the big trend in relative strength was a good exit signal.
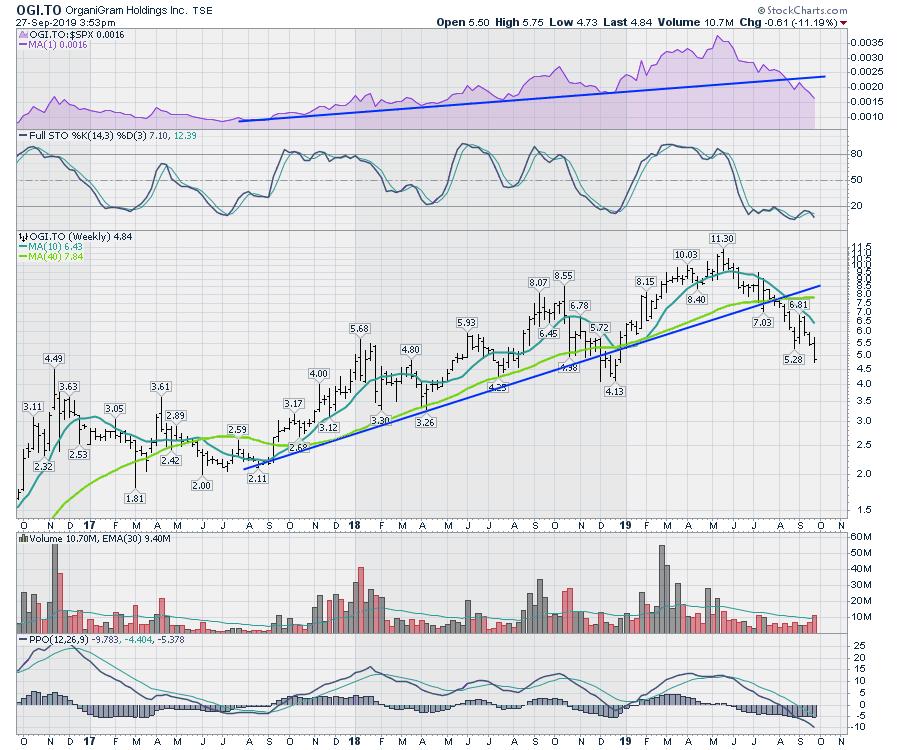
Below is Organigram (OGI.TO). This one just listed on the US side, but to no avail. The selling continues.
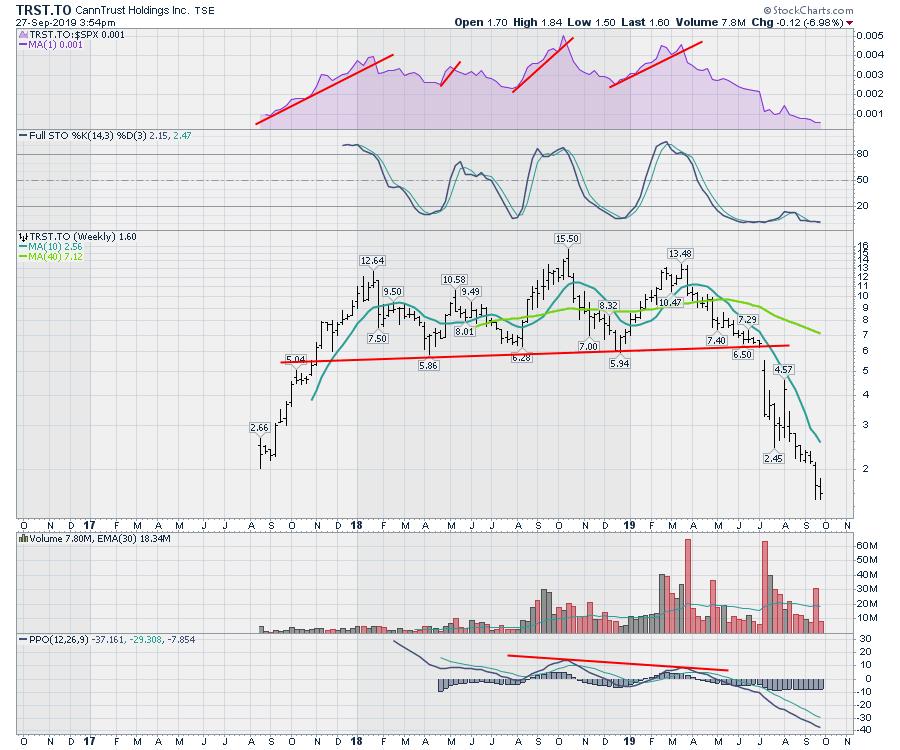
CannTrust Holdings (TRST.TO) was not to be trusted. The stock went from euphoria to depression regularly. Very few investors made money here if they didn't sell and re-enter, as the stock oscillated in a range for a long period of time. When it broke below that range, most investors probably thought it would bounce again, but it never did. The huge gap down and the plummeting price bar as it broke support was also evil. It was almost a 50% loss in one week, making it even harder for long-term investors to sell. Anybody still owning the stock has lost money. We are back below the IPO.
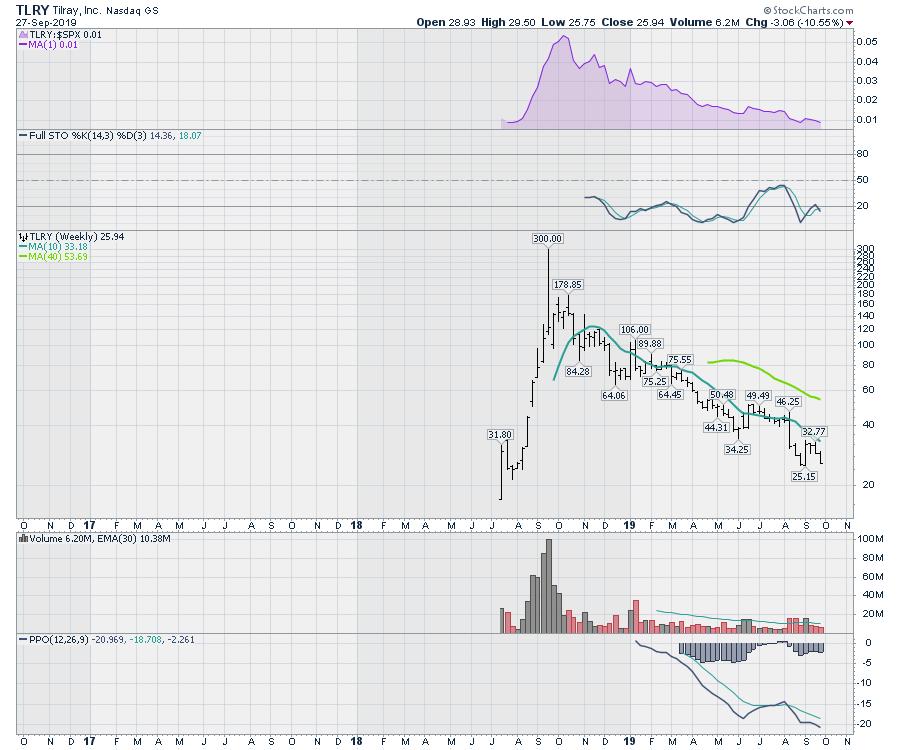
Tilray (TLRY) soared on the IPO and continued to run for weeks. It was a classic parabolic stock run that implodes. While long-term investors have seen their wealth soar and plummet, only the few buy-and-holders on the first few weeks after the IPO have any profits.
After one year, from the highs of Weed Wednesday, we can see how tricky it is to be invested in these strong groups and know when to exit. I wrote a few articles during the past year where the stocks looked like they were starting to set up. The important part is looking for the setups. When they fail, let the stop kick you out.
Please pass this article on to the young investors you know. I have a few that I want to pass this on to as well. Maybe even pass it on to the new investors who are middle-aged! Trading the news of the industry would have been disastrous; most new investors would have donated money to the experienced crowd who exited at peak hysteria.
If those investors are interested in learning more about investing, they may find my Stock Charts For Dummies book helpful. It can be found on StockCharts, Amazon and other book retailers.
Lastly, investing is hard work. It is emotional when the stock runs up and then pulls back. What should you do?
I will be sending out a new subscription model for a greatly reduced price to those who have followed me to this point, where I am launching my new service. If you are interested, please go to gregschnell.com and add your email address to the list. I keep thinking that we are just a few days away from having it all working, but it's taking a bit to get the subscriptions and payment systems working. I hope to send out the first email from the website in the next few days.
Thanks for following my work!
Good trading,
Greg Schnell, CMT, MFTA
Senior Technical Analyst, StockCharts.com
Author, Stock Charts For Dummies
Want to stay on top of the market's latest intermarket signals?
– Follow @SchnellInvestor on Twitter
– Connect with Greg on LinkedIn
– Subscribe to The Canadian Technician
– Email at info@gregschnell.com


