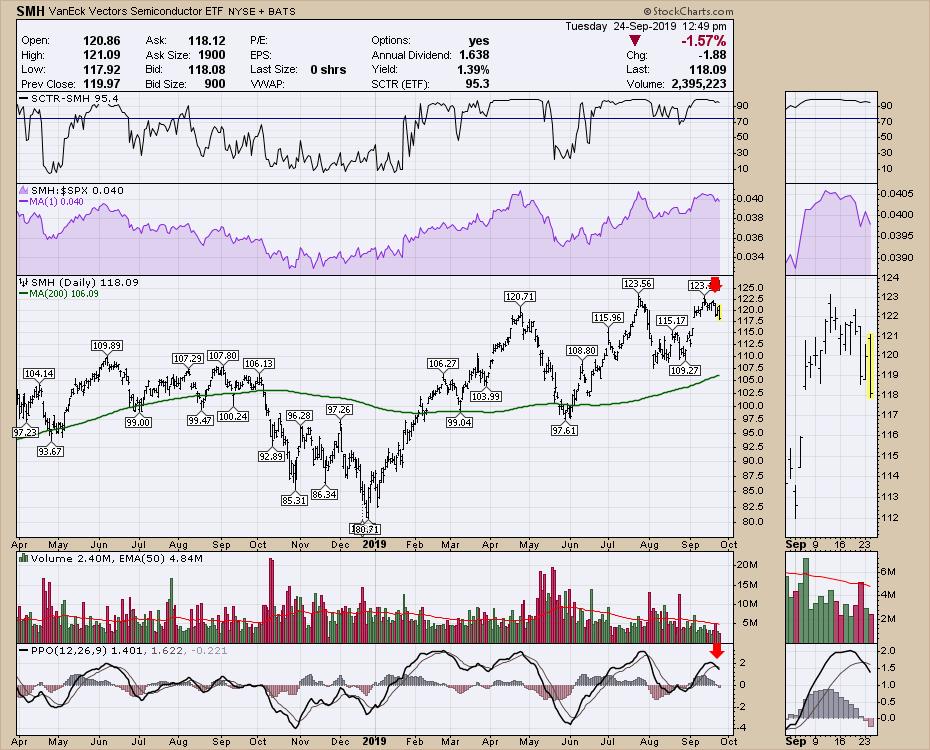
Over the weekend, I was very surprised to see how many industry groups had stalled last week as we attempted to go through to new highs. Some lodged failed breakouts, while others reversed before breaking out. A good example was the SMH (semi's ETF).
On Tuesday morning, the $VIX broke out above the 10-week moving average again. This time, though, the PPO momentum was already above zero. This is an important clue, as the PPO momentum above zero on the weekly chart highlights some rough times to be invested over the last two years.
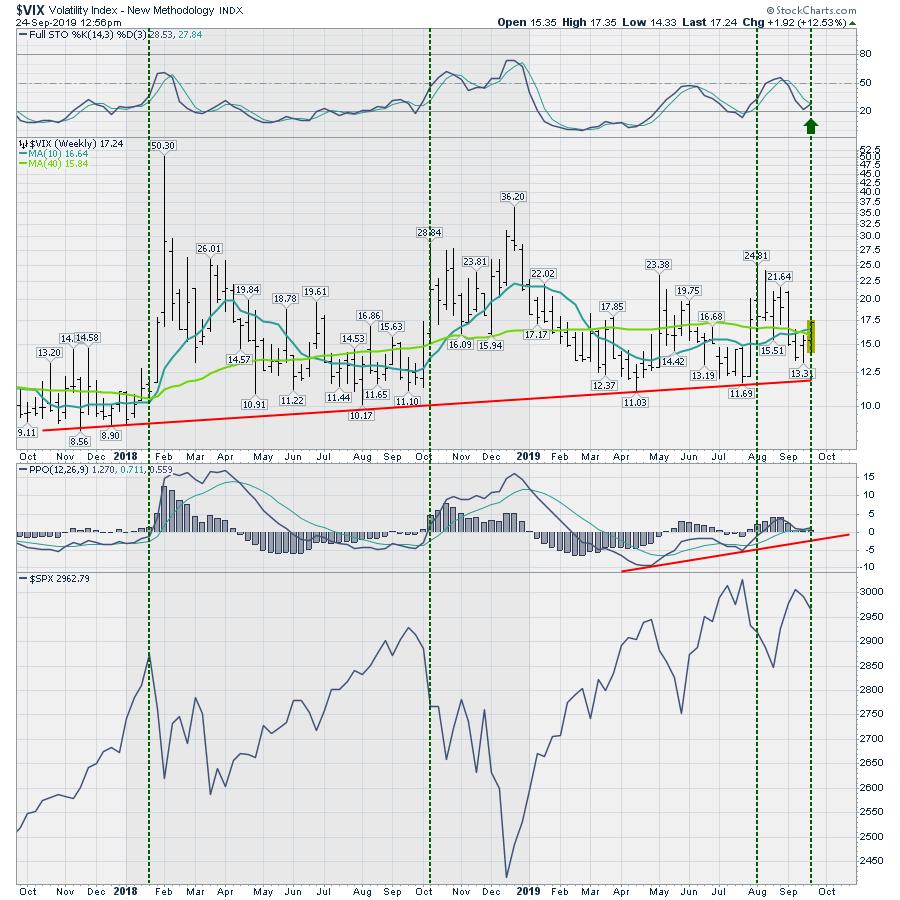
The above chart is a weekly chart, so we need to see the chart end at this level, not just get through there mid-week. If you had a chance to read my ChartWatchers Newsletter on the weekend, I mentioned the market was setting up for another pullback after a rocky environment since May. Read it here: A Rough Week Is Behind Us, But What Is Ahead?
All that to say, turnaround Tuesday is bringing in some rough water. Keep watching to see if does break down. My work suggests that this is an important inflection point.
Good trading,
Greg Schnell, CMT, MFTA
Senior Technical Analyst, StockCharts.com
Author, Stock Charts For Dummies
Want to stay on top of the market's latest intermarket signals?
– Follow @SchnellInvestor on Twitter
– Connect with Greg on LinkedIn
– Subscribe to The Canadian Technician
– Email at info@gregschnell.com


