As the major indexes continue to test the highs, we are watching to see if breadth widens out. Financials are moving up this week following JPM's earnings last week. For those of you keeping up with my work, you'll remember I previously suggested watching the financials to see if they can get going. Technology and semiconductors continue to stall, but the financials have been moving up.
Moving to the industrials sector, Boeing (BA) has been under pressure of late, but another Dow component is surging to the fore. The industrials are an important sector of the economy. We want to see this sector break out after being stuck for 21 months. UTX is a Dow component and a major influence in the sector, and its chart is now lining up at the previous highs.
The top two indicators show UTX as just a middle-of-the-road stock that tracks the large caps and floats around the 50% level against its peers in terms of price performance. The SCTR reading has never been terrible (i.e. in the bottom 10%), but it never outperforms above 75 either. It's just... average. But a breakout to new highs would probably suggest that the indexes could also breakout to a new high. It's worth watching. The purple area chart is the second indicator. We can see that the stock performs in line with the S&P 500. Never outperforming, never underperforming, just waddling in line.
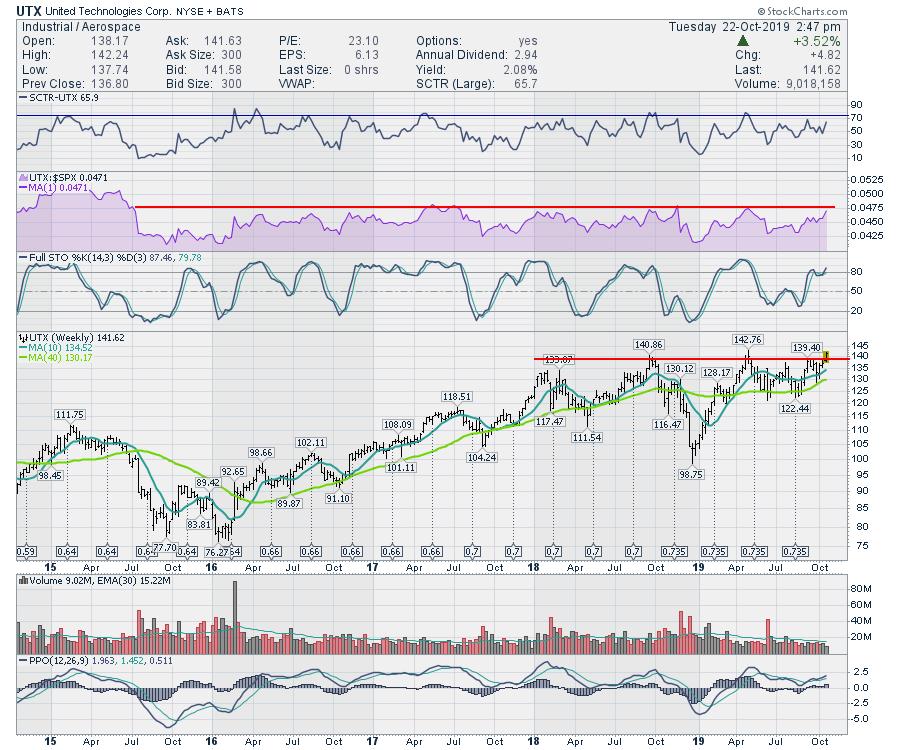
The price action looks like it could finally break out. The volume has been below average for most of the year, but momentum, shown by the PPO indicator, is improving. However, whenever we test a prior high, we need to be cautious in case we fail at this level again. If the elevator starts going down, I wouldn't ignore the direction. This chart will probably be a good clue to see if the 4th quarter can go higher, so Don't Ignore This Chart.
Also, if you would like to connect with my new newsletter service, go to GregSchnell.com and click on the "Private Investors" tab.
Good trading,
Greg Schnell, CMT, MFTA
Senior Technical Analyst, StockCharts.com
Author, Stock Charts For Dummies
Want to stay on top of the market's latest intermarket signals?
– Follow @SchnellInvestor on Twitter
– Connect with Greg on LinkedIn
– Subscribe to The Canadian Technician
– Email at info@gregschnell.com


