The SPY ETF is having another rough start in October. We all know what happened last year, and it seems improbable to expect the same market behavior two years in a row. Having said all of that, the setup is similar and the ETF continues to cycle down in enthusiasm. Once again, the 50-day moving average has rolled over and is pointing down.
So far, the week of the Fed meeting and the Quadruple witching marked the high. The down thrust days seem to have had significantly more momentum. While it feels like the market has been going sideways, the bounce Friday was a failed move back towards the highs. This looks extremely weak to me.
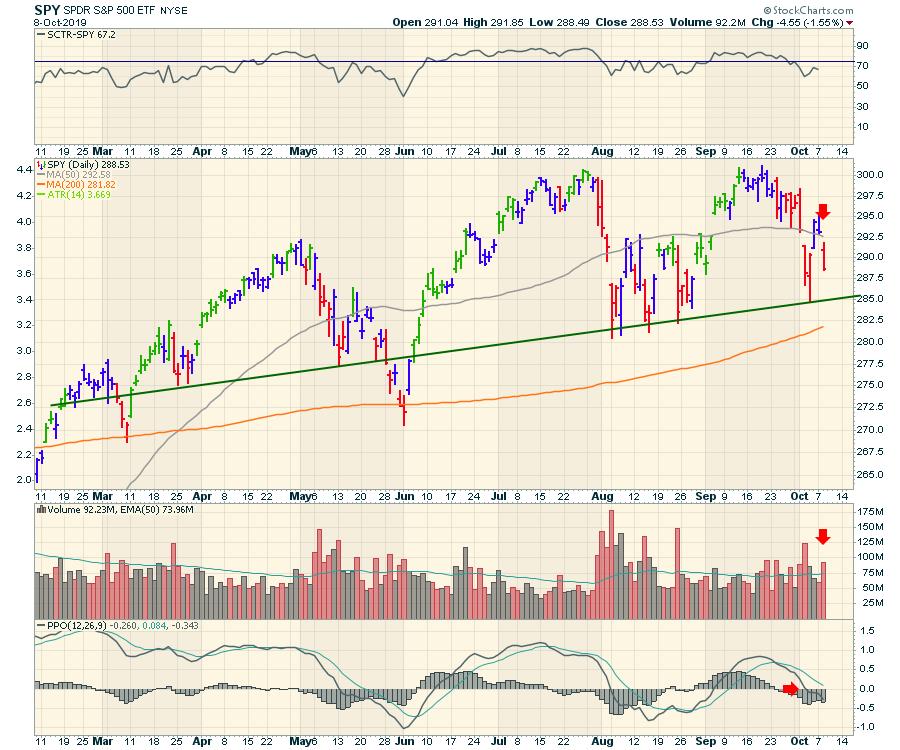
I feel like I am aware of all the other major news points, but it's the chart that tells the story. We continue to see the potential for a confirmed double top. I have drawn a trend line across most of the lows where the market has repeatedly bounced, though there are two exceptions a little lower.
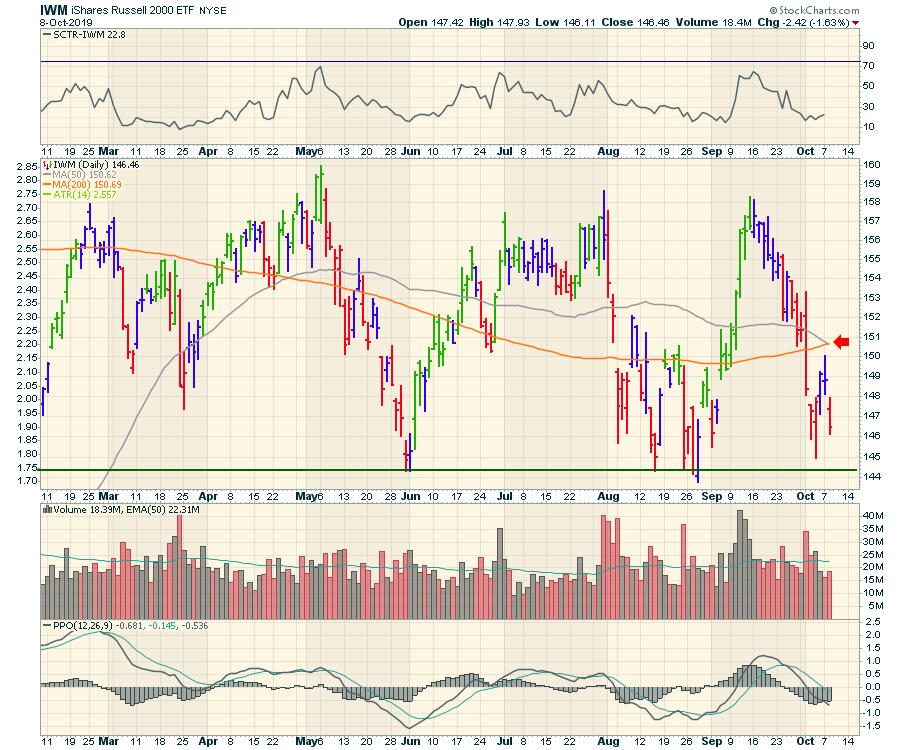
The IWM represents the Russell 2000. It too has been holding above a support zone in a weaker part of the market, but is currently testing the lows. It sits about 1% above the support level. We also got a bearish signal with the bearish cross today, where the 50-day moving average crosses below the 200-day moving average.
I remain concerned that the market lets go here with poorer news out of the trade situation today. It all adds up to watching these important technical levels. Should they fail, it leaves lots of room to move lower. With the up days making small moves and the down days having significant size, it appears the buyers are lacking as the market pulls back. Each time, the bulls loose a little more faith.
Good trading,
Greg Schnell, CMT, MFTA
Senior Technical Analyst, StockCharts.com
Author, Stock Charts For Dummies
Want to stay on top of the market's latest intermarket signals?
– Follow @SchnellInvestor on Twitter
– Connect with Greg on LinkedIn
– Subscribe to The Canadian Technician
– Email at info@gregschnell.com


