 Growth vs Value - Weekly
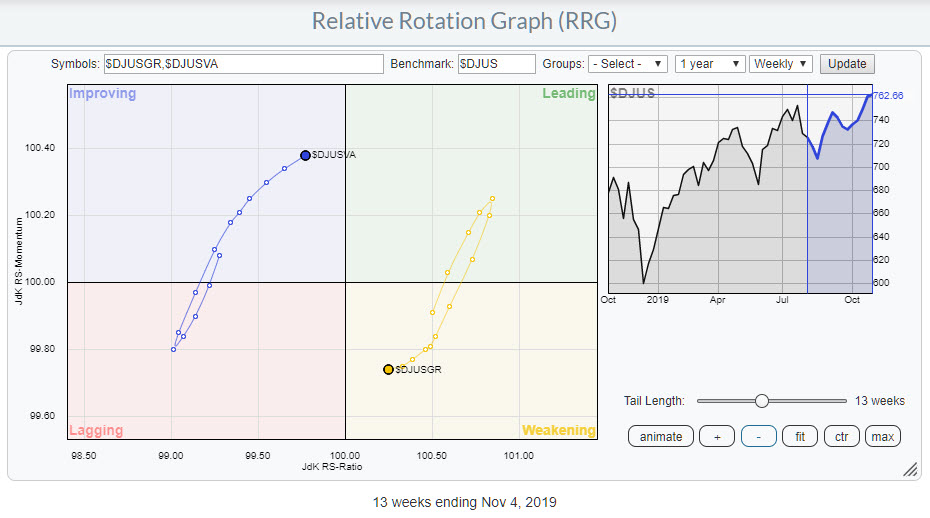
The Growth vs. Value relationship is always an interesting topic, as many believe it provides (additional) information or support for directional moves in the general market (S&P 500).
The Relative Rotation Graph above shows the relationship between these two market segments, using the DJ US index as the benchmark. As this is a so-called "closed universe," the securities on the plot together are the benchmark, their rotational patterns are, more or less, inverted.
This weekly RRG shows value rapidly heading for the leading quadrant; growth, meanwhile, is equally rapid, heading for the lagging quadrant.
Daily
 Growth vs. Value - Daily
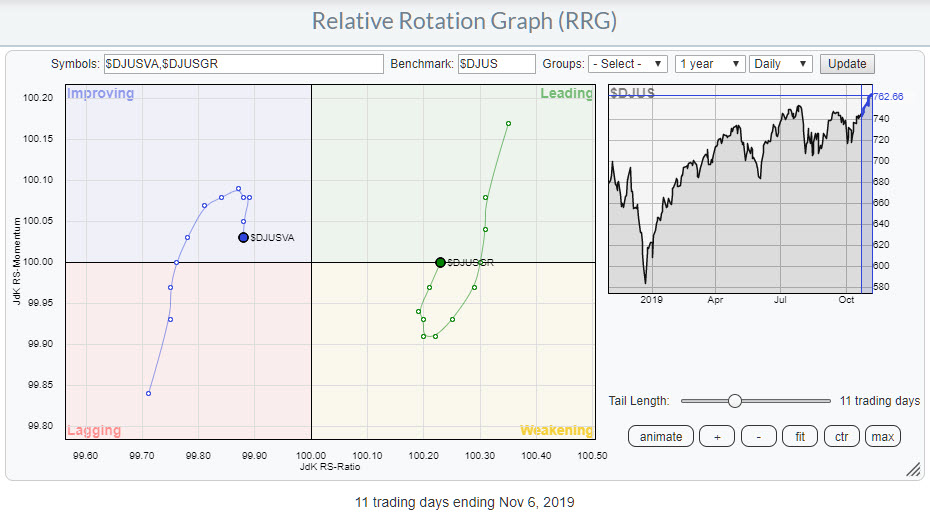
On the daily RRG, Growth is at the right hand side of the plot and is just now returning from weakening back into leading. Usually, this is a strong sign as it signals the second (or third, etc.) leg in an already established uptrend. Value at the left is obviously going through the reverse rotation, back to lagging. The crux here is to figure out which time frame will be leading the way in coming weeks.
The tails on the daily chart are just turning around; very likely, we will have more of that rotation, growth over value, in store.
On the weekly RRG, the distances between the observations over the last 5-6 weeks have decreased compared to the 5-6 weeks prior. That signals a loss of power for that move on the weekly scale and often precedes a turn.
With the daily rotations just about to start a new up- /down- leg in their respective trends, I am inclined to go with the scenario where the daily rotation will be leading the way in coming weeks, eventually pulling the weekly rotations around while remaining on their respective sides of the RRG. In essence, Growth at the right, positive, side and Value at the left, negative, side.
- Julius
Want to stay up to date with the latest market insights from Julius?
– Follow @RRGResearch on Twitter
– Like RRG Research on Facebook
– Follow RRG Research on LinkedIn
– Subscribe to the RRG Charts blog on StockCharts
Feedback, comments or questions are welcome at Juliusdk@stockcharts.com. I cannot promise to respond to each and every message, but I will certainly read them and, where reasonably possible, use the feedback and comments or answer questions.
To discuss RRG with me on S.C.A.N., tag me using the handle Julius_RRG.
RRG, Relative Rotation Graphs, JdK RS-Ratio, and JdK RS-Momentum are registered trademarks of RRG Research.
Julius de Kempenaer
Senior Technical Analyst, StockCharts.com
Creator, Relative Rotation Graphs
Founder, RRG Research
Host of: Sector Spotlight
Please find my handles for social media channels under the Bio below.
Feedback, comments or questions are welcome at Juliusdk@stockcharts.com. I cannot promise to respond to each and every message, but I will certainly read them and, where reasonably possible, use the feedback and comments or answer questions.
To discuss RRG with me on S.C.A.N., tag me using the handle Julius_RRG.
RRG, Relative Rotation Graphs, JdK RS-Ratio, and JdK RS-Momentum are registered trademarks of RRG Research.


