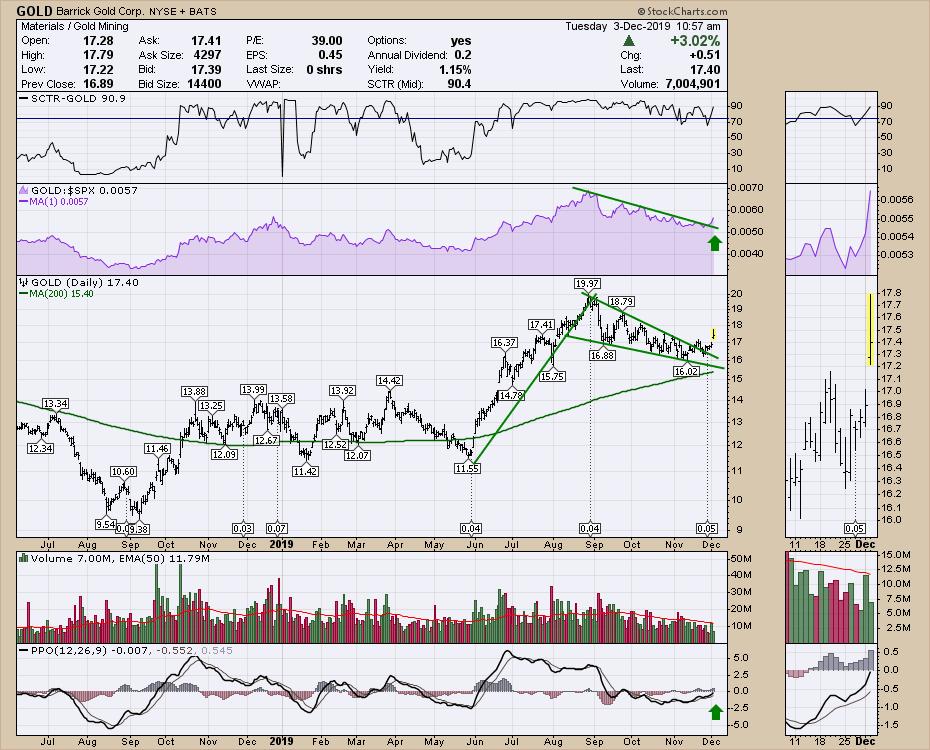
Barrick Gold (GOLD), the largest gold miner in the world according to their website, got some mojo going yesterday morning. Recently the gold stocks have been setting up and it looks like Barrick is starting to break the consolidation or flag pattern it was in.

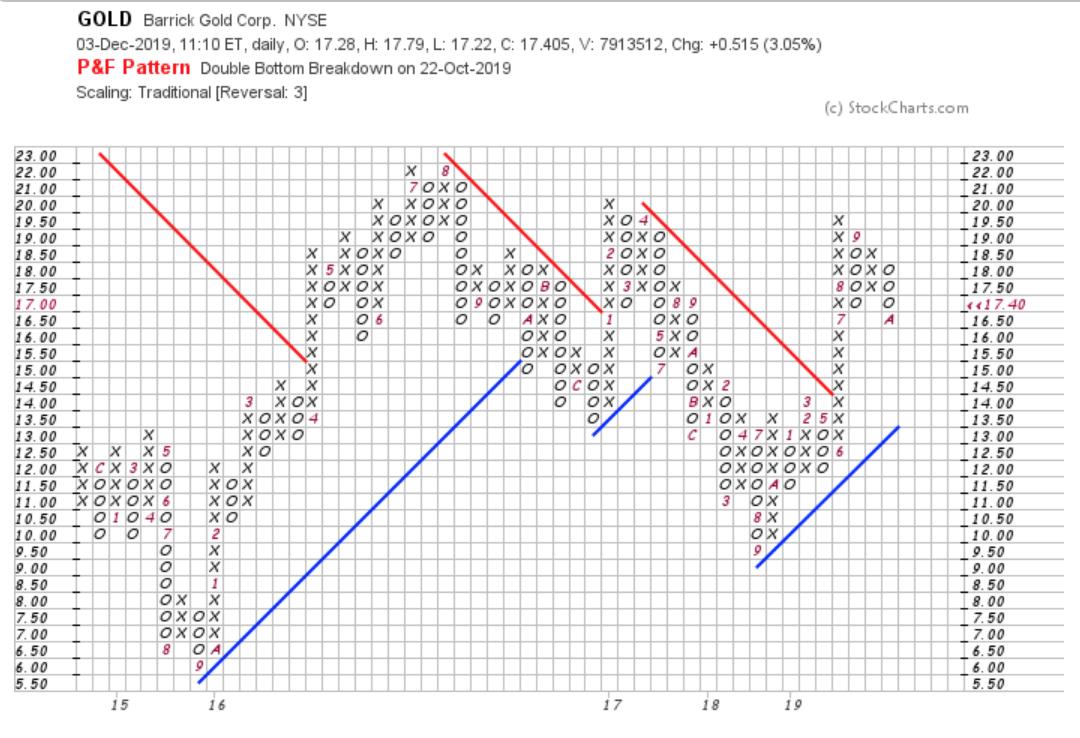
Barrick's price chart is responding well to a new CEO and some recent acquisitions. The reference to a flag pattern is clearer on P&F charts; usually, this pattern is a continuation pattern with an upside followthrough.
 Gold, the precious metal, has been setting up nicely and I have been monitoring it for a breakout. Yesterday morning, the initiation move was what we had been expecting. To see the gold miners all respond suggests this is the move we are waiting for, with tight stops underneath.
Members of GregSchnell.com received my newsletter over the weekend suggesting the market could be starting to pull back, with one of my short-term indicators only 39% bullish. If you would like help spotting these timely setups in the market and are interested in becoming a member at GregSchnell.com, visit the private investors tab.
I'll be speaking at the Market Vision 20/20 conference on January 4th, 2020 with a host of other StockCharts analysts. For more information on the early bird special, follow this link: Market Vision 2020.
Good trading,
Greg Schnell, CMT, MFTA
Senior Technical Analyst, StockCharts.com
Author, Stock Charts For Dummies
Want to stay on top of the market's latest intermarket signals?
– Follow @SchnellInvestor on Twitter
– Connect with Greg on LinkedIn
– Subscribe to The Canadian Technician
– Email at info@gregschnell.com


