Is Bitcoin ($BTCUSD) worse than driving through a Canadian winter on mountain roads? You can have cold weather, but dry roads. You can have nasty icy weather and temperatures near freezing. But it's those icy roads that are way worse than deep cold temperatures with clear pavement. Interestingly, Bitcoin has seemingly been following the weather forecast for the last 18 months. In July 2018, we had a summertime peak, followed by the early December lows. As spring approached, Bitcoin broke out of a wintery base and soared up to the summer solstice. Since then, it has been sliding.
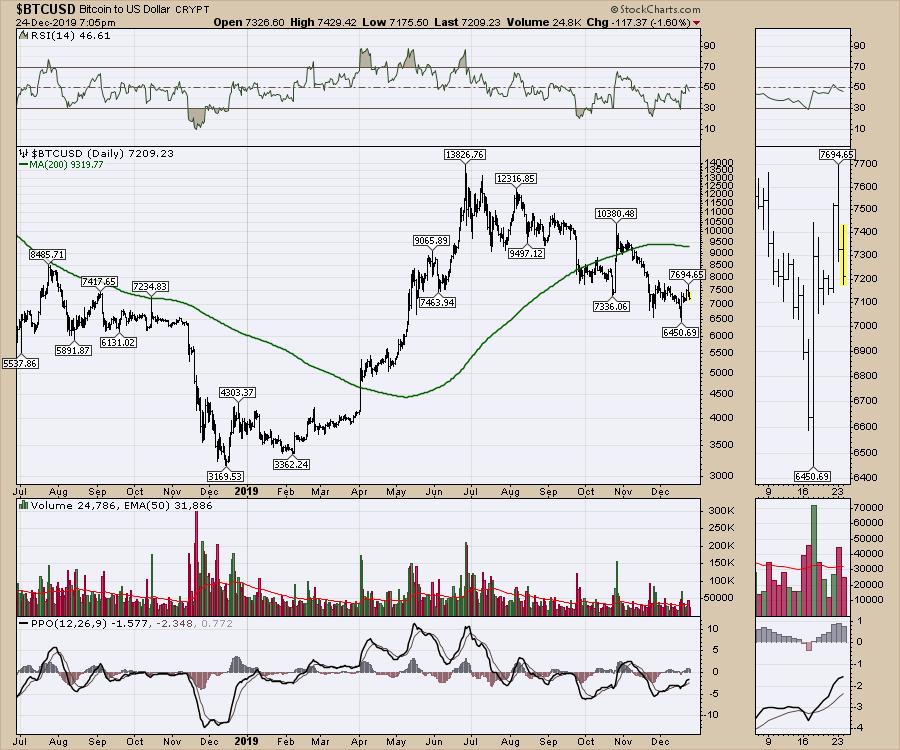
Can we count on another December low to start the year?
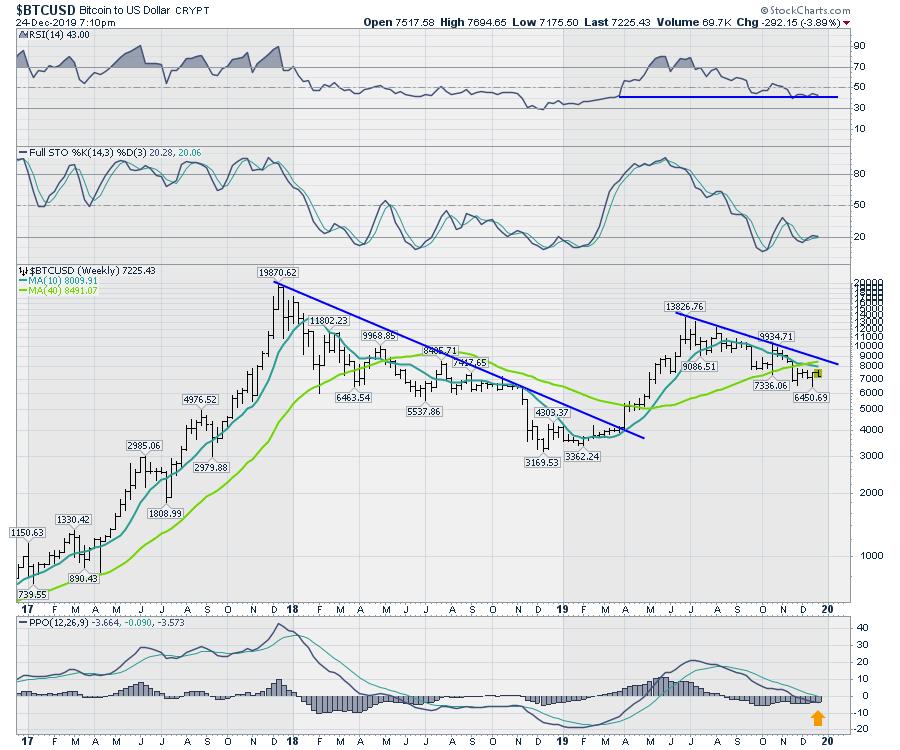
The daily chart is too fine a detail for me, so let's look at the weekly. We can see similar slopes on the two downtrends. We don't need to be early here, as this is as close to emotional trading as we can get. No specific underlying value, just pure trading and speculation at the rawest form.
However, there are some good technical signals to note. First of all, the PPO is below zero and pointing down. That's not a great entry - let someone else build the base. If the PPO (momentum indicator) can turn up and, subsequently, be sloping upward and headed above zero, that is a much better entry location. The RSI holding at forty is associated with bullish market behavior, so that is a positive that could support the PPO turning up soon. The 10-week moving average below the 40 is associated with a simple bear market configuration, so there is no need to be the first into Bitcoin here.
Have a wonderful holiday season and a great investing year in 2020. If you have not signed up to get information for the MarketVision 2020 conference on January 4th, 2020 follow this link for more information!
Good trading,
Greg Schnell, CMT, MFTA
Senior Technical Analyst, StockCharts.com
Author, Stock Charts For Dummies
Want to stay on top of the market's latest intermarket signals?
– Follow @SchnellInvestor on Twitter
– Connect with Greg on LinkedIn
– Subscribe to The Canadian Technician
– Email at info@gregschnell.com
