 NOV - Weekly bar chart with RS and RRG-Lines
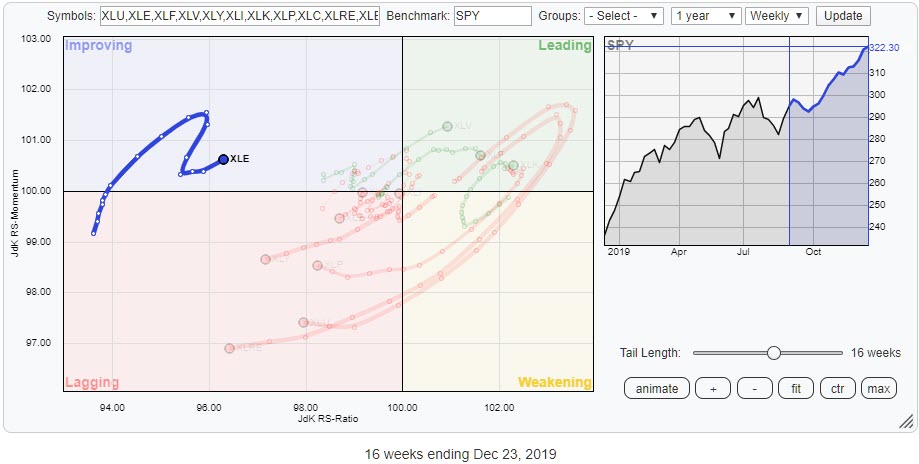
On the above Relative Rotation Graph, the Energy sector (XLE) hooked back towards a positive RRG-Heading while inside the improving quadrant. In terms of the JdK RS-Ratio, it is still the weakest sector, but things seem to be starting to improve.
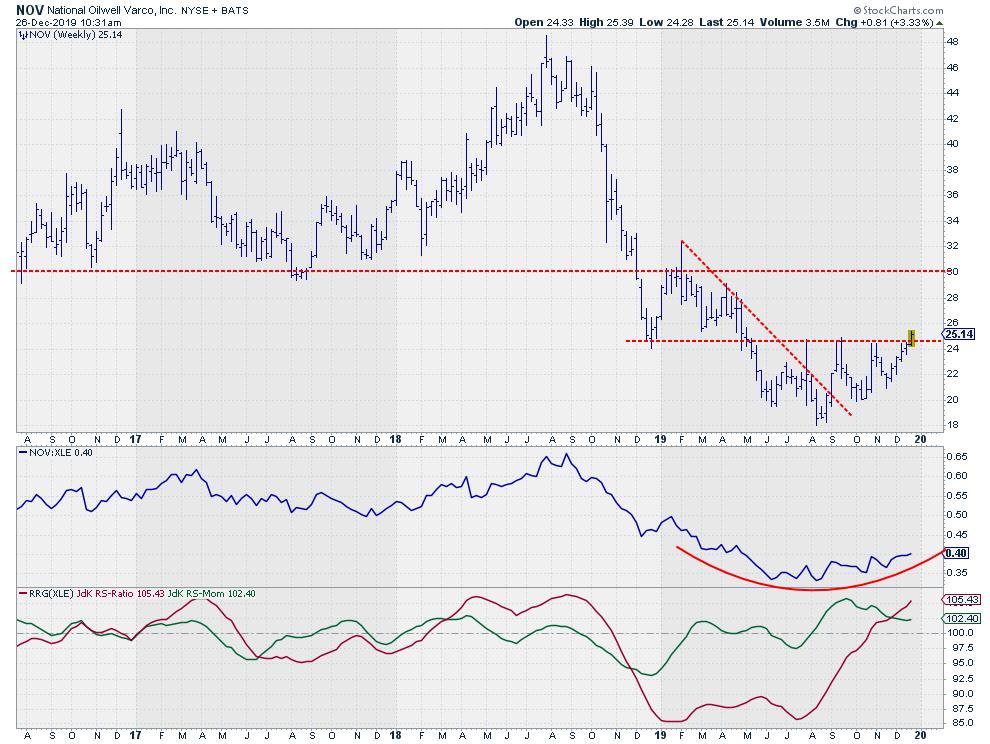
Although the sector as a whole may not be ready for you to fully invest in, there are definitely a few stocks inside the sector that are worth an extra look. One of these names is NOV, National Oilwell Varco.
The chart above shows how NOV dropped from $48 to $18 within a year, from August 2018 to August 2019. After the stock found support in the area around $18, a consolidation process started that lasted a few months and currently seems to be on the verge of being broken upwardly.
On the weekly bar chart, price is peeking above the horizontal barrier at $24.75. If we are able to hold above this level at this Friday's close, the road is free for a rally towards $30, where the next overhead resistance level is found.
From a relative perspective, the RS-Line is completing a rounding bottom and has just started a series of higher highs and higher lows. The RRG-Lines are now both comfortably above 100, positioning NOV well inside the leading quadrant and at a positive RRG-Heading.
When the improvement in the Energy sector manages to continue, NOV could be one of the stocks leading the charge.
--Julius
My regular blog is the RRG Chartsblog. If you would like to receive a notification when a new article is published there, simply "Subscribe" with your email address.
Julius de Kempenaer
Senior Technical Analyst, StockCharts.com
Creator, Relative Rotation Graphs
Founder, RRG Research
Want to stay up to date with the latest market insights from Julius?
– Follow @RRGResearch on Twitter
– Like RRG Research on Facebook
– Follow RRG Research on LinkedIn
– Subscribe to the RRG Charts blog on StockCharts
Feedback, comments or questions are welcome at Juliusdk@stockcharts.com. I cannot promise to respond to each and every message, but I will certainly read them and, where reasonably possible, use the feedback and comments or answer questions.
To discuss RRG with me on S.C.A.N., tag me using the handle Julius_RRG.
RRG, Relative Rotation Graphs, JdK RS-Ratio, and JdK RS-Momentum are registered trademarks of RRG Research.
Julius de Kempenaer
Senior Technical Analyst, StockCharts.com
Creator, Relative Rotation Graphs
Founder, RRG Research
Host of: Sector Spotlight
Please find my handles for social media channels under the Bio below.
Feedback, comments or questions are welcome at Juliusdk@stockcharts.com. I cannot promise to respond to each and every message, but I will certainly read them and, where reasonably possible, use the feedback and comments or answer questions.
To discuss RRG with me on S.C.A.N., tag me using the handle Julius_RRG.
RRG, Relative Rotation Graphs, JdK RS-Ratio, and JdK RS-Momentum are registered trademarks of RRG Research.


