 Weekly RRG showing Fidelity Funds
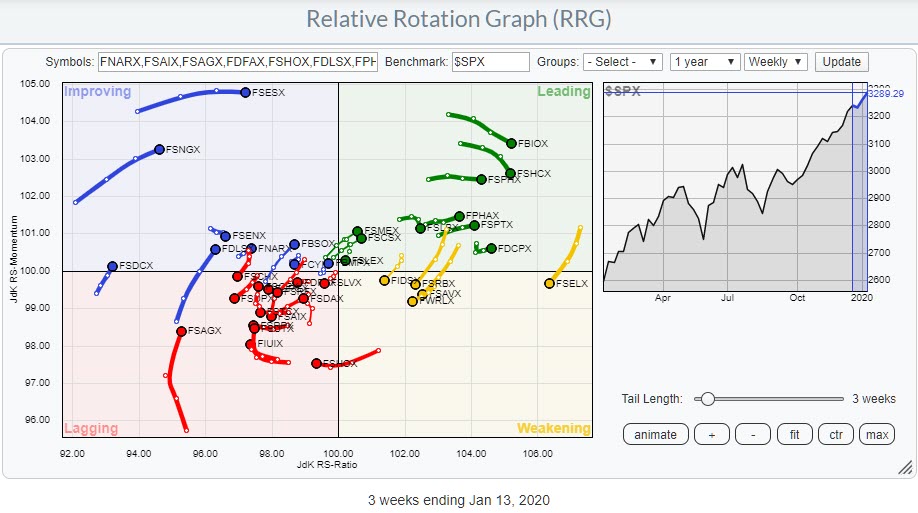
If you are using Fidelity Funds, a Relative Rotation Graph showing the movement of all these funds can help you find the ones that are offering potential (for outperformance). The image above shows such a Relative Rotation Graph, holding 39 Fidelity Select funds.
Going over the funds on this chart, I searched for tails with interesting rotational path. Ultimately, I identified these six funds for further inspection.
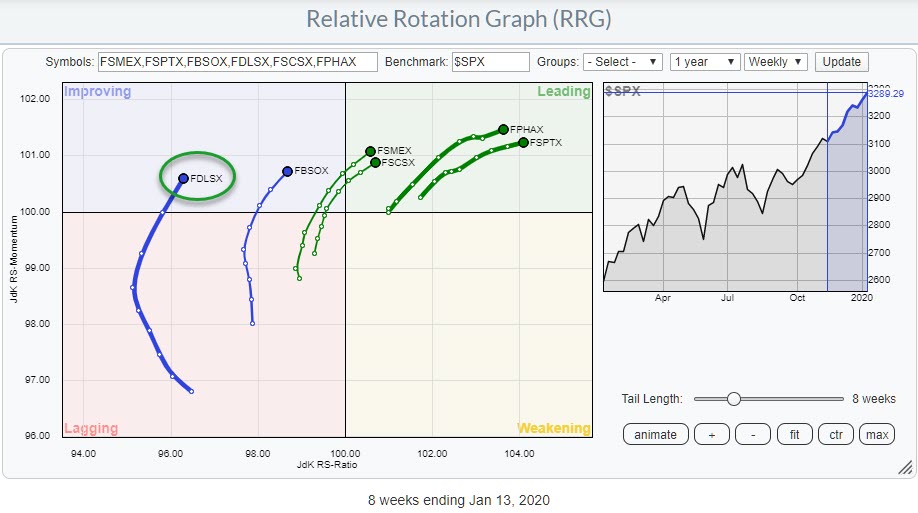
Going over the individual charts clearly shows that the funds furthest to the right on the RRG are well underway in their (relative) uptrends. Which also means that the potential alpha that is left on the table is getting less. A fund showing leftward movement indicates that it is in an earlier stage of a moves/rotation. Of course, there is always a trade-off between reliability/risk of a trend and the potential gains that can be captured.
On the far right, we have trends that are well-established and well underway and, therefore, quite reliable; at least, until they start to roll over and lose momentum. Further to the left are the more emerging trends, which hold more risk because they are not yet established - but the pay-off will be bigger when the trend actually starts to get underway.
Out of these six funds, the Fidelity Select Leisure fund (FDLSX) seems to offer the biggest potential.
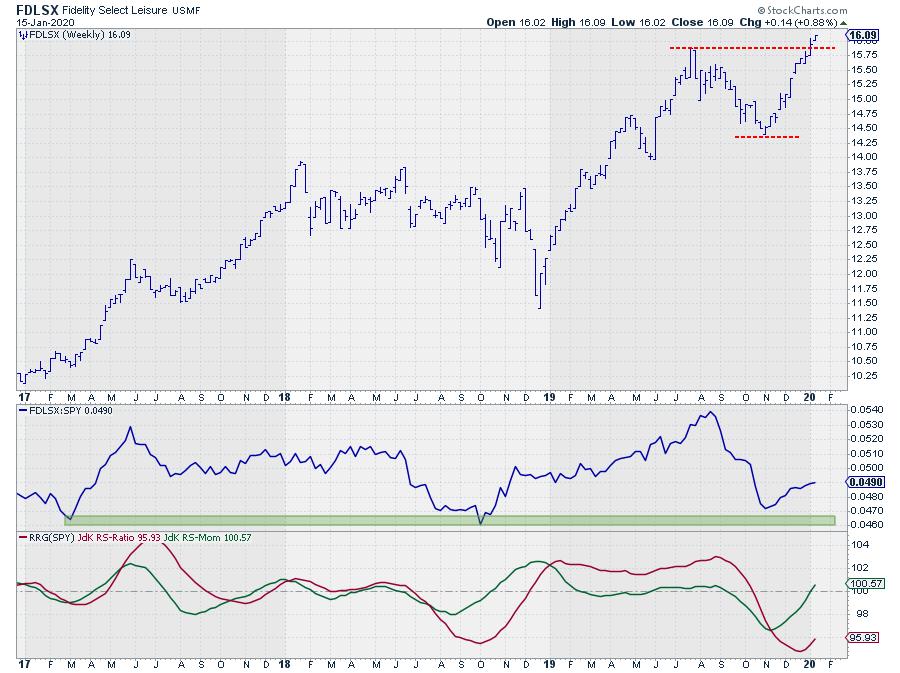
The chart for this fund shows that it very recently broke out above its previous high (July 2019), which unlocks fresh upward potential from a price perspective.
The most recent low in price coincides with the low in relative strength. The rally out of that low since mid-November has caused the RS-Line to start moving higher. The RRG-Lines have picked up on this improvement and are now moving higher in tandem.
Assuming that the upward break in price will hold up and good support (= limited risk) can be expected at the level of the previous high, this rotation will have the potential to travel further toward the leading quadrant at a positive RRG-Heading, providing a good opportunity to outperform the S&P 500 in coming weeks/months.
--Julius
My regular blog is the RRG Chartsblog. If you would like to receive a notification when a new article is published there, simply "Subscribe" with your email address.
Julius de Kempenaer
Senior Technical Analyst, StockCharts.com
Creator, Relative Rotation Graphs
Founder, RRG Research
Want to stay up to date with the latest market insights from Julius?
– Follow @RRGResearch on Twitter
– Like RRG Research on Facebook
– Follow RRG Research on LinkedIn
– Subscribe to the RRG Charts blog on StockCharts
Feedback, comments or questions are welcome at Juliusdk@stockcharts.com. I cannot promise to respond to each and every message, but I will certainly read them and, where reasonably possible, use the feedback and comments or answer questions.
To discuss RRG with me on S.C.A.N., tag me using the handle Julius_RRG.
RRG, Relative Rotation Graphs, JdK RS-Ratio, and JdK RS-Momentum are registered trademarks of RRG Research.
Julius de Kempenaer
Senior Technical Analyst, StockCharts.com
Creator, Relative Rotation Graphs
Founder, RRG Research
Host of: Sector Spotlight
Please find my handles for social media channels under the Bio below.
Feedback, comments or questions are welcome at Juliusdk@stockcharts.com. I cannot promise to respond to each and every message, but I will certainly read them and, where reasonably possible, use the feedback and comments or answer questions.
To discuss RRG with me on S.C.A.N., tag me using the handle Julius_RRG.
RRG, Relative Rotation Graphs, JdK RS-Ratio, and JdK RS-Momentum are registered trademarks of RRG Research.


