Bankers have been one of the strongest areas in the market since the October 15th, 2019 JPM earnings. In December, they began underperforming the $SPX, and with JPM reporting year-end last week, it's a good time to review the bank chart. It was not just JPM who reported; we also heard from other systemically important names like BAC and C.
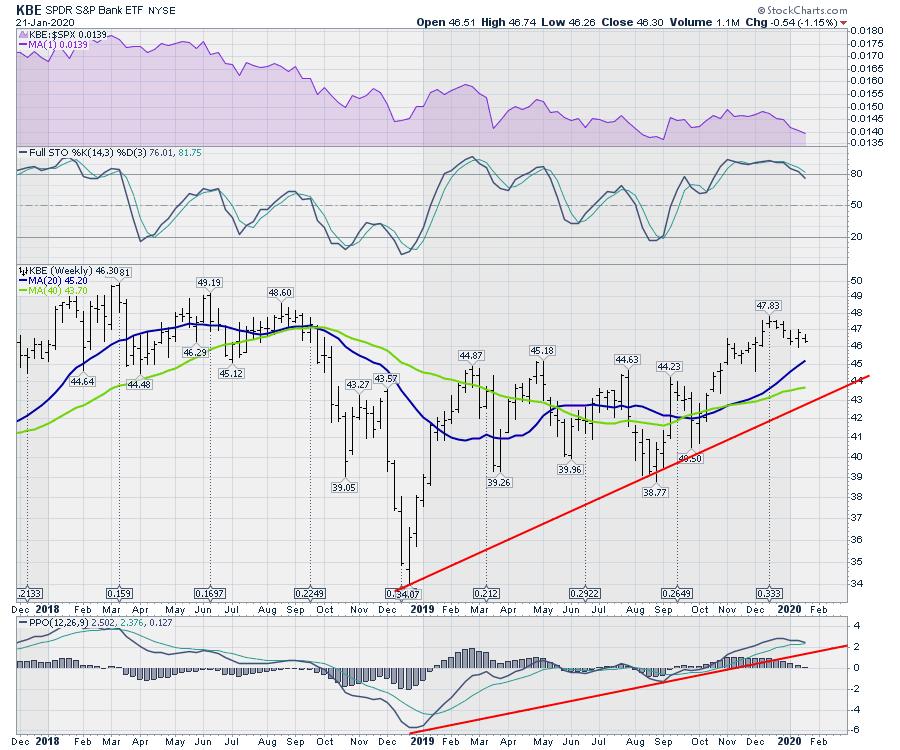
Here is the KBE Bank ETF. Notice that the PPO is rolling over and starting to threaten the momentum uptrend off the 2019 low. Banks have also been declining for 6 weeks. That is a concerning divergence with the broader market surging higher (ok... flying higher). One of the other points of interest on the chart is the lower 2019 high compared to 2018.
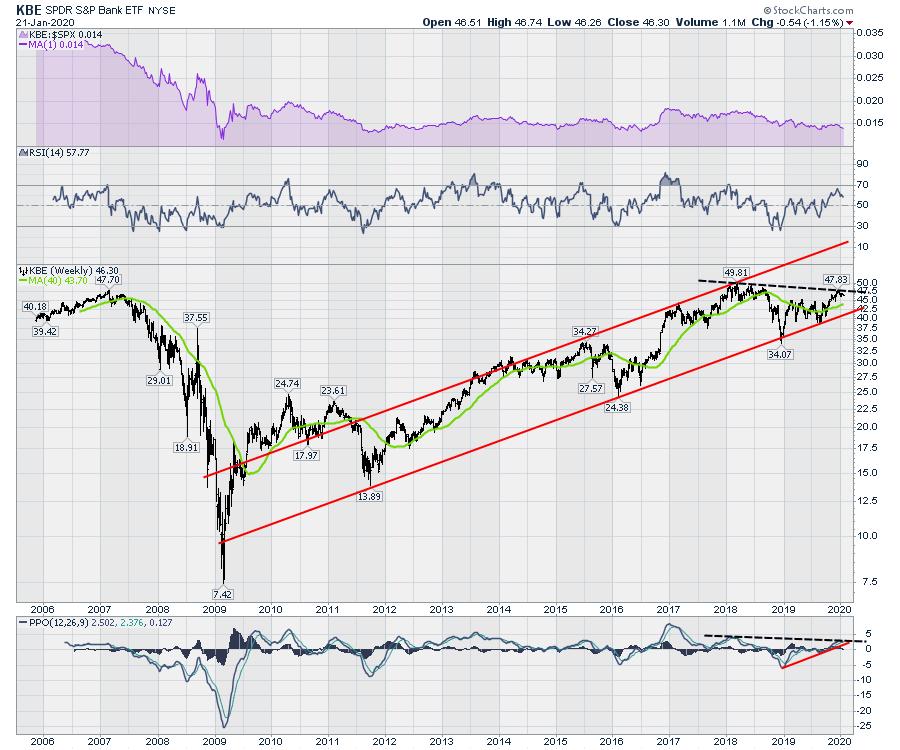
Broadening out the chart adds a little context to a potentially lower high here. After having the PPO dip below zero in 2018, the rally, back up after a year, has still left us with a lower high. The current price makes it look like the prior high could be significant longer-term as the rest of the market has gone higher than the 2018 highs.
It's too early to call a major top in the financials here, but it is not too early to scope out "what-if" situations. If financials are starting to put in lower highs even after the Fed has started the easing cycle, we should all be prepared for a market correction that might be signaled by a weaker bank chart. As one senior bank technician told me during my first trip to the CMT Association symposium, "When the banks start making lower highs, be concerned."
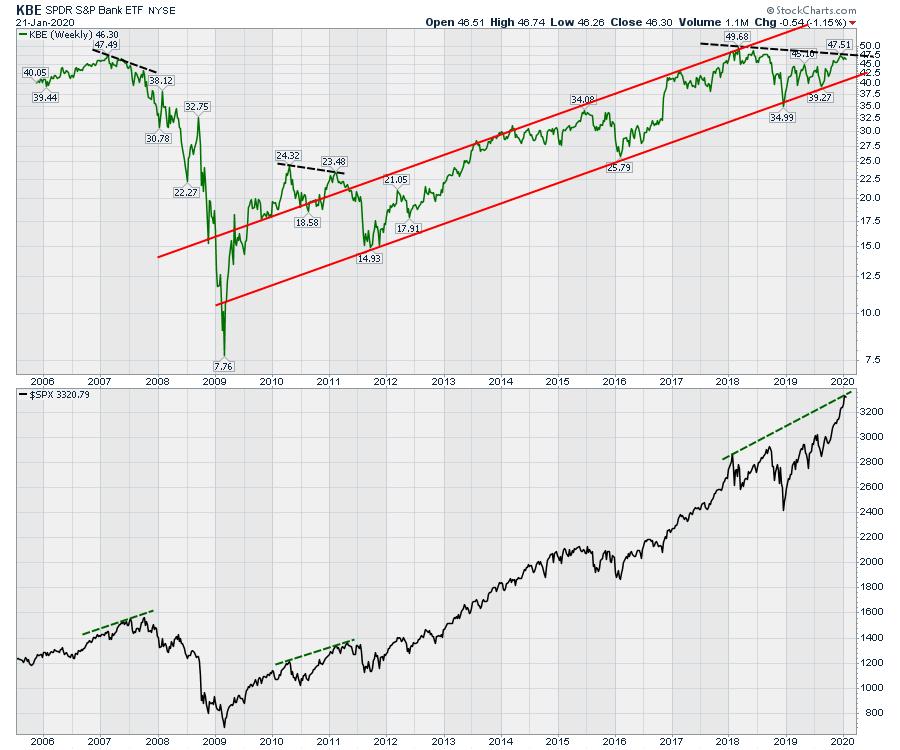
In 2007, the banks made a lower October high while the SPX made a higher high. An 83% drop.
In 2011, the banks made a lower January high while the SPX made a higher high. A 36% drop.
In 2015, there was no real divergence between the banks and the $SPX. A 24% drop.
In 2018, the banks made a lower September high while the SPX made a higher high. A 29% drop.
What if... in 2019, the banks make a lower December high while the SPX makes a higher high?
Again, it's too early to say the top is in for the banks. It is not too early to map out the potential consequences of that.
I was on The Final Bar with David Keller on Wednesday, January 21 (today). Here is a link to the show!
I'll cover the banks off on the Market Buzz show Wednesday morning at 10:30 AM ET on StockCharts TV. Click here to check the show out when it starts live!
Good trading,
Greg Schnell, CMT, MFTA
Senior Technical Analyst, StockCharts.com
Author, Stock Charts For Dummies
Want to stay on top of the market's latest intermarket signals?
– Follow @SchnellInvestor on Twitter
– Connect with Greg on LinkedIn
– Subscribe to The Canadian Technician
– Email at info@gregschnell.com


