When the market tanks, like it did from 24 February onwards, there is not much you can do anymore. You basically have to sit and wait and see which level(s) support or resistance are respected by the market. And the problem is, you will not know until a few days later...
It is only when the market starts to bounce, and new peaks and troughs are set, that the market will start to give us some new clues/pointers. (At least for the short-term.)
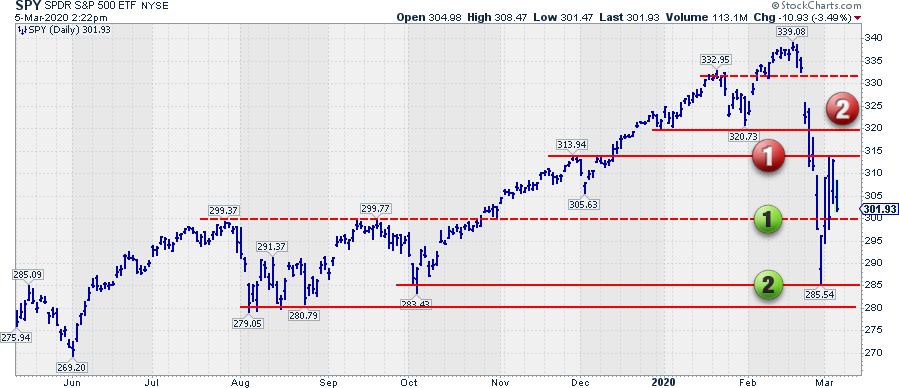
In my last ChartWatchers article, "This is My Trendline, Which One is Yours?" (part 2), I highlighted the long-term levels for SPY that I am watching. So far, the former rising resistance line between 285-290, now support, has been holding up. That is the good news, and it provides us with guidance on the longer term outlook/scenarios.
In this article, I want to quickly zoom in on the short-term developments and the new clues/levels that the market is providing us with in the aftermath of the (first) big swing down.
The steep decline off the high found support at the aforementioned long-term support level in the 285-290 area. This level is marked with the green (2) on the chart above and is now the most important support level to watch in the coming days/weeks. It is the level where the buyers were willing to step in, pick up the supply that was coming to the market and push it back up.
In the move lower, SPY breached the horizontal support level around 299.50 as if it did not exist. This is marked with the green (1) in the chart above. I have dashed that level, as it lost some of its reliability once it got breached.
After setting the low at 285.50, SPY bounced back to set a new high at (almost) 314. Only now, 2 days after that happened, we can label that high as a "high" because the market was not able to push beyond that peak for two days.
That level is marked with the red (1) in the chart above and it is the first important resistance level to watch going forward. The second level of resistance is marked with the red (2). That is the former support level offered by the January lows, which is now expected to act as resistance.
The chart below shows recent developments on a 2-hour timeframe.
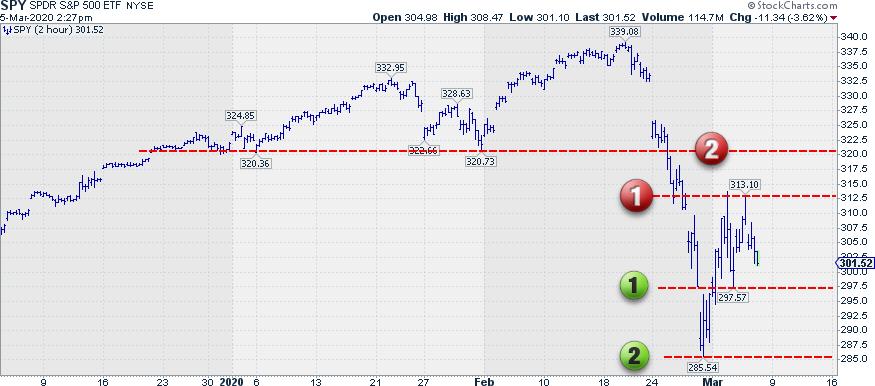
The red- and green-marked resistance and support levels correspond with the markers on the daily chart above and show more detail.
I will be watching those four levels, assume a further move in the direction of the break and, when it happens, absorb all new clues that the market will provide us with.
--Julius
My regular blog is the RRG Charts blog. If you would like to receive a notification when a new article is published there, simply "Subscribe" with your email address.
Julius de Kempenaer
Senior Technical Analyst, StockCharts.com
Creator, Relative Rotation Graphs
Founder, RRG Research
Want to stay up to date with the latest market insights from Julius?
– Follow @RRGResearch on Twitter
– Like RRG Research on Facebook
– Follow RRG Research on LinkedIn
– Subscribe to the RRG Charts blog on StockCharts
Feedback, comments or questions are welcome at Juliusdk@stockcharts.com. I cannot promise to respond to each and every message, but I will certainly read them and, where reasonably possible, use the feedback and comments or answer questions.
To discuss RRG with me on S.C.A.N., tag me using the handle Julius_RRG.
RRG, Relative Rotation Graphs, JdK RS-Ratio, and JdK RS-Momentum are registered trademarks of RRG Research.
Julius de Kempenaer
Senior Technical Analyst, StockCharts.com
Creator, Relative Rotation Graphs
Founder, RRG Research
Host of: Sector Spotlight
Please find my handles for social media channels under the Bio below.
Feedback, comments or questions are welcome at Juliusdk@stockcharts.com. I cannot promise to respond to each and every message, but I will certainly read them and, where reasonably possible, use the feedback and comments or answer questions.
To discuss RRG with me on S.C.A.N., tag me using the handle Julius_RRG.
RRG, Relative Rotation Graphs, JdK RS-Ratio, and JdK RS-Momentum are registered trademarks of RRG Research.


