For those dealing first hand with the COVID-19 virus, it's real. For those in areas yet unaffected, it is surreal. Life goes on. Talking to some individuals the other day and they were suggesting everyone is being so irrational. I asked how rational would they be if it showed up in the complex where we were staying? That changed the tone on everyone's faces pretty quick. If you are in an unaffected zone, it is seemingly okay.
As the numbers start to add up with 800 cases digging in around the USA, it is clearly a difficult issue. With businesses emptying out buildings and schools emptying out dorms, it really is a big reset.
On the back of the news of Italy shutting down the country, the market rallies 1100 Dow points. Are we worlds apart and North America will miss the brunt of it, or is it just short-term trading whatever direction the market wants to run for the hour?
I don't think there is a chart for this that makes sense. China has squashed the ability for the market to price in the downside. While people are trying to get back to work there, the Financial Times writes doubt into their article that not enough time has passed. So let's not use that market just yet.
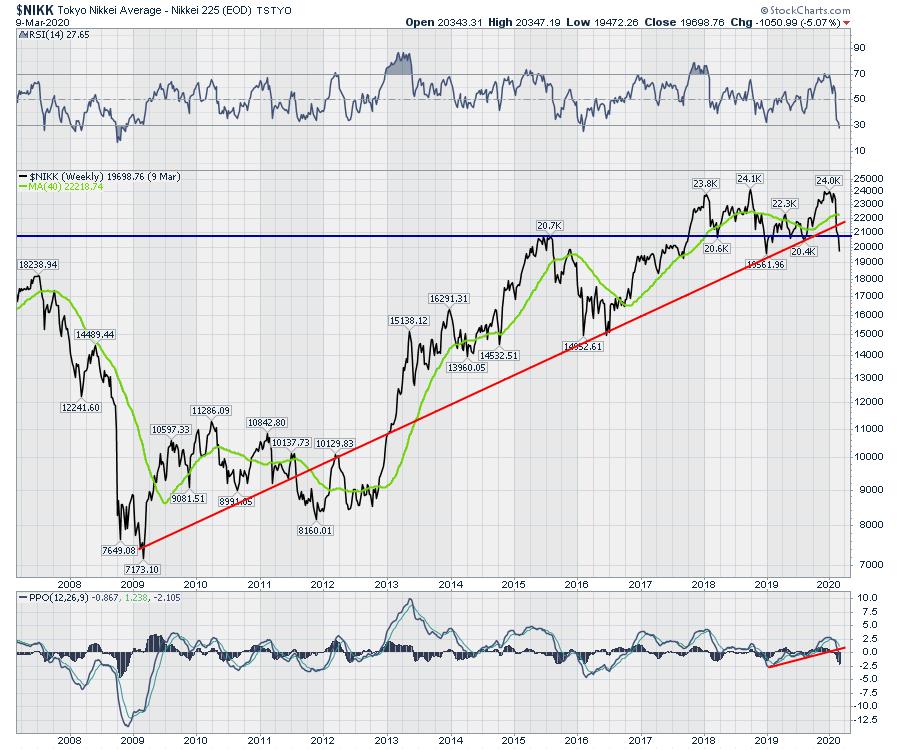
Japan and South Korea are heavily impacted. Japan is trying to figure out the plan for the Olympics. The $NIKK shows the investor approach there, much more so than the Shanghai index.
There are a few hundred points between the Nikkei weekly closing lows of 2018 and the current price. A breach of that level would make 30 month lows. The uptrend has already been broken. The real question is, where is support? There is a triple top on the chart.
Rolling into South Korea, the chart is approaching the 8-year trend line right now. That is a problem, but, at this point, the chart looks largely intact. Can it bounce again? Notice how low the 2020 high is compared to the 2018 high.

Italy, with its countrywide lockdown, seems to be massive at this point. It is trading at a three-year low. Notice how the 10-year ceiling on this index just keeps showing up. An equivalent drop next week would make 5-year lows.

Eleven countries in Europe have over 100 cases each. In the UK, the count soared huge in a week, but it seems so extreme on a percentage basis it seems wrong. The UK is facing a number of issues as it gets the coronavirus through multiple streams. The travel hub of London Heathrow, the link to Hong Kong, an international financial center and the virus impacting all of these strengths. Lay Brexit on top and it is really struggling. The chart is broken. A similar move to this week and London would be at 5-year lows.

Here is the chart for the rate of growth in Europe. Without question, the growth rate in percentage terms is extreme coming from such small numbers. But, as each country has a hub show up, the issues are big.
 Massachusetts doubled their count in one day. The State of New York is trying to control an area outside of New York City. I'll let you decide the trend for the impact on the US economy. Seattle is under pressure and so is California. If both coasts are under pressure, and major hubs like Seattle, San Francisco, New York, Washington and Boston are seeing surging numbers, the market has to work through all that to find value.
The bottom line, don't be drawn into a fear-of-missing-out trade. You can miss the first ten percent and still catch a good rally when this is all over. Let the institutional investors form the bottom.
Check out my chart below for the Schnell Strength Indicator and see if it can help you manage your risk better. It was at 2% last week before this market drop on Monday.
MEMBERSHIP SALE:
There is a sale for new subscribers for annual members. Use the Coupon Code NETWORTH1 for savings of over 40%. Get Greg's award-winning Technical Analysis now.
Testimonials, IMPORTANTLY ALL THESE ARE FROM AFTER THE DECLINE!
"Just a note to let you know how much I have come to rely on your timely market info. Whether its a trend about to take off to the upside or an alert to let people know that the market is due for a correction.. You have helped me a great deal on timely entries and exits. Keep up the excellent work.
- Thanks Barry - March 5, 2020
"Greg, I have followed your work for many years, and your insight has not only steered me correctly in the Markets, but made and saved me in the turns and twists over many years! I cannot wait to read your work, and as you know, a faithful follower – you are one of the best in your business that I have found over my 50 years of investing!"
- Bob A. USA - March 4, 2020
"The chart trails that you guide with are convincing and have led to probable outcomes since I have been a member. I had moved into cash & bonds before this February decline thanks to your work that saved me nearly 90K."
- Mark F. Colorado - March 4, 2020
MEMBERSHIP SALE:
There is a sale for new subscribers for annual members. Use the Coupon Code NETWORTH1 for savings of over 40%. Get Greg's award-winning Technical Analysis now.
On Monday, we had the drop in crude. We still have the COVID-19 issues, weakness in Europe, etc. While buying the dips is sporty, keep your risk controlled.
I want to show you a chart that I share every week with my subscribers. This single chart helped them be aware of the risks coming in what seemed like a happy market on February 21st. I created this chart using momentum indicators and it helps tell me how strong the overall market is. The yellow vertical lines represent sell signals. It also tells me when morale is improving. While it is not my only signal, it helps me communicate with subscribers to avoid the big downturns. It will also get us in close to the lows. While it appears to be signaling early in January 2020, we did have a big Dow-down-600 drop to end the month. In hindsight, a Dow-down-600 day feels like a rainy day compared to what we have recently seen.

The indicator is not designed to pick the top. It is designed to help get our profits protected or out before the market breaks down hard. In 2018, it was excellent. In 2020, it sniffed a problem in January, but kept creating declining tops into February. My comments in the newsletter on February 22nd were that this was a market running on fumes.
The most important thing to do now is wait for a better entry, and hopefully you have some entry signals you like. If not, perhaps consider the sale on annual memberships to GregSchnell.com.
I have set up a sale for new subscribers as annual members. Use the Coupon Code NETWORTH1 for savings of over 40%. Get Greg's award-winning Technical Analysis now.
Testimonials
Here are some more of the testimonials I have received in the last few days, following the decline. I think hearing from investors following my work through the decline is important because it would be easy to agree when the markets are at the highs.
"I do not make any decisions until I have viewed and watched your videos. You have saved me, from my self, several times. Thanks for shedding the light on this market."
- Rory R, Colorado March 8, 2020
"I have been following Greg for three years. I count on his thorough technical analysis of the markets including the commodities to assist me in understanding the big picture. Greg is an outstanding technical analyst. - (Spelling correction on words 'thorough' and 'analyst' by Greg). Thank you for your insight."
- Dave D, March 8, 2020
Best wishes in this current environment. If $10 a week can help you be a lot more aware of market strength and weakness, hopefully you'll find value in my newsletter.
Be flexible here; this is a difficult market. In case you missed the replay of an article I wrote, which investigated the effects of a weak oil industry on the economy back in 2016, here is the link: Oil and The Dominoes.
Good trading,
Greg Schnell, CMT, MFTA
Senior Technical Analyst, StockCharts.com
Author, Stock Charts For Dummies
Want to stay on top of the market's latest intermarket signals?
– Follow @SchnellInvestor on Twitter
– Connect with Greg on LinkedIn
– Subscribe to The Canadian Technician
– Email at info@gregschnell.com


