What a week...
Where do I start???
Let's just say that this was not a boring week for the markets...... at all!
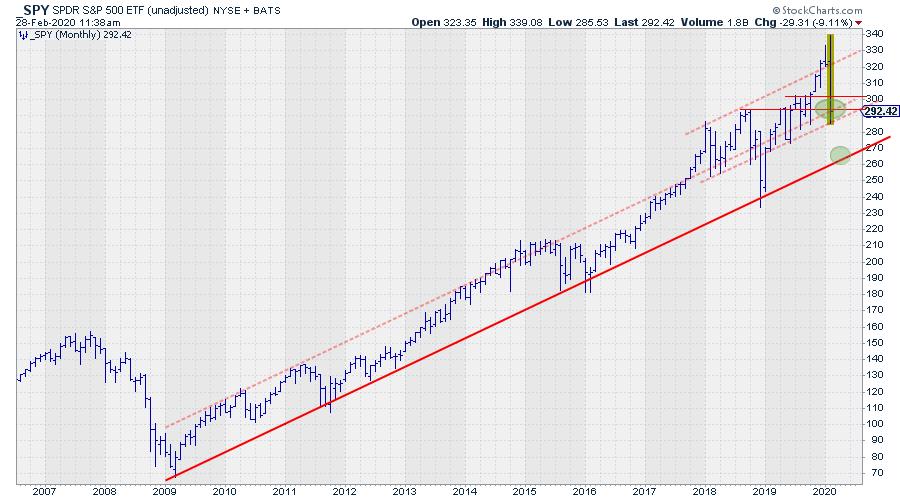
When markets go crazy and swings get out of control, I have learned to step back and look at the bigger picture - and keep it simple. While doing so, I remembered writing an article titled "This is My Trendline, Which One is Yours?". I actually needed to dig into the archive to find it; it was published August 6, 2019.
In that article, I introduced a trendline that starts out of the early 2009 low and, up to the article's publication, had been touched six to eight times (depends a bit on how strict you want to be on what is a "touch" ). I'd say that makes it a reliable trendline.
I referred to that trendline again, and added some other annotations, in my Sector Spotlight episode at the start of February. The video below starts at the moment where I look at the long-term S&P chart.
The chart at the top of the article is the same chart as in the video, but has now been updated to (almost) the end of the month. SPY has now arrived at the first support zone in the 290 area. Whether this means we have a buying opportunity remains to be seen; the power behind the current move is pretty big and you do not want to jump in front of a freight train.
If we see some sort of relief and support kicking in at these levels, a short-term buying opportunity may arise for daring, risk-seeking short-term traders. I would be looking for at least a few days of consolidation in this area, along with preferably a bounce, a second test of support and maybe the completion of a double bottom before pulling the trigger.
If that does not happen, and we break lower again next week (or bounce with the next move down falling below the current level), we are very likely in for another ride down. In that case, my second green oval becomes the next price target. That means 260-270 for SPY, roughly another 10% off current levels.
Rotation to Defensive Sectors Ongoing
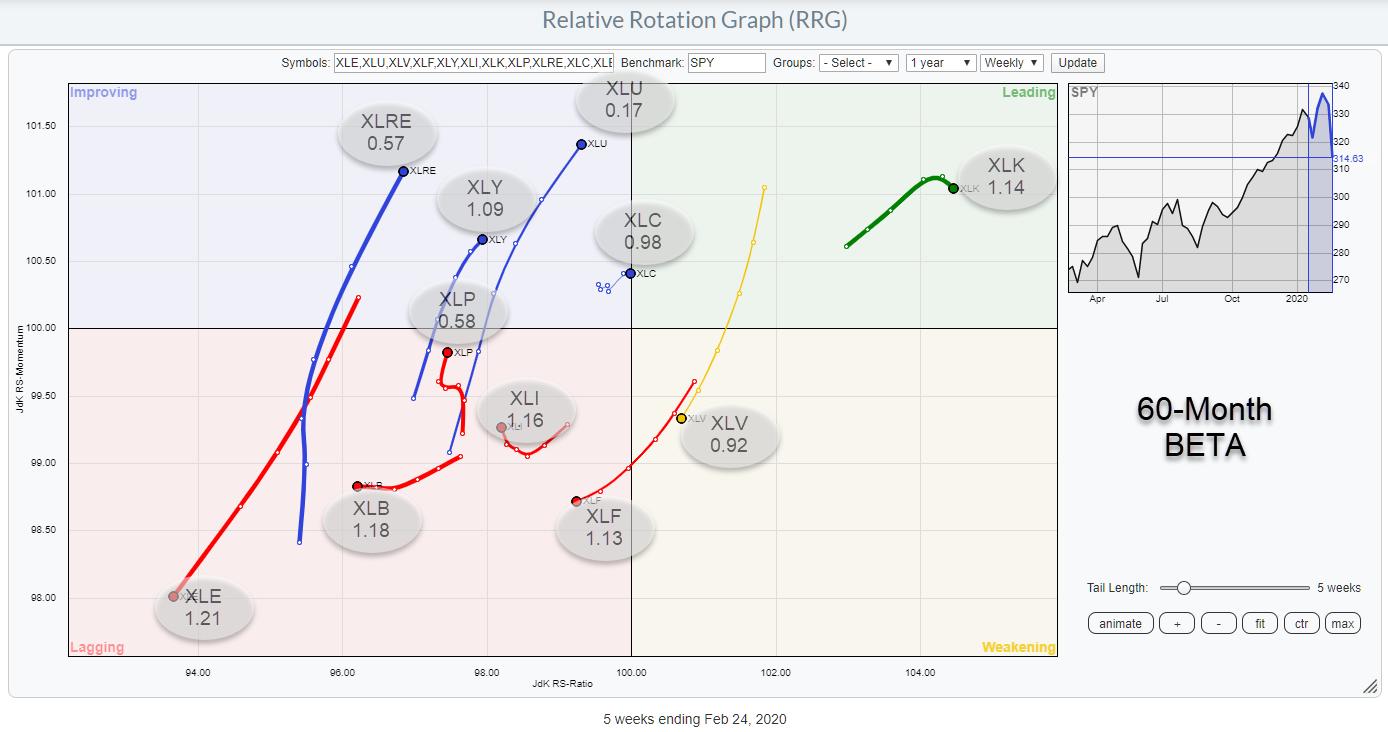
On the Relative Rotation Graph, we see a continuation of the rotation towards defensive sectors. The chart above has the 60-month trailing BETA for each sector overlaid. Generally, the low BETA sectors are defensive while the high BETA sectors are more offensive.
Very clearly, we can see the strong rotations, long tails and strong headings for Utilities and Real-Estate. Both consumer sectors are still doing well on the weekly RRG but, on the daily version, Staples are now taking over from Discretionary (as expected), so we may need to take into account the possibility that XLY will start to turn around inside improving without hitting leading while XLP will start improving more and faster.
Two outliers on this chart: XLK, which is the only sector inside leading AND has a high BETA, and XLV, which has BETA below 1 (albeit only marginally so) while heading towards the lagging quadrant. For these two sectors, the daily rotations are catching up, showing XLK close to crossing over into lagging while XLV is now at a strong RRG-Heading inside improving.
The most important takeaways with regard to the rotations for defensive sectors is that these are in their early stages, which means that they have plenty of room to improve further and continue their rotations along their current paths.
Enjoy your weekend....
--Julius
My regular blog is the RRG Charts blog. If you would like to receive a notification when a new article is published there, simply "Subscribe" with your email address.
Julius de Kempenaer
Senior Technical Analyst, StockCharts.com
Creator, Relative Rotation Graphs
Founder, RRG Research
Want to stay up to date with the latest market insights from Julius?
– Follow @RRGResearch on Twitter
– Like RRG Research on Facebook
– Follow RRG Research on LinkedIn
– Subscribe to the RRG Charts blog on StockCharts
Feedback, comments or questions are welcome at Juliusdk@stockcharts.com. I cannot promise to respond to each and every message, but I will certainly read them and, where reasonably possible, use the feedback and comments or answer questions.
To discuss RRG with me on S.C.A.N., tag me using the handle Julius_RRG.
RRG, Relative Rotation Graphs, JdK RS-Ratio, and JdK RS-Momentum are registered trademarks of RRG Research.
Julius de Kempenaer
Senior Technical Analyst, StockCharts.com
Creator, Relative Rotation Graphs
Founder, RRG Research
Host of: Sector Spotlight
Please find my handles for social media channels under the Bio below.
Feedback, comments or questions are welcome at Juliusdk@stockcharts.com. I cannot promise to respond to each and every message, but I will certainly read them and, where reasonably possible, use the feedback and comments or answer questions.
To discuss RRG with me on S.C.A.N., tag me using the handle Julius_RRG.
RRG, Relative Rotation Graphs, JdK RS-Ratio, and JdK RS-Momentum are registered trademarks of RRG Research.


