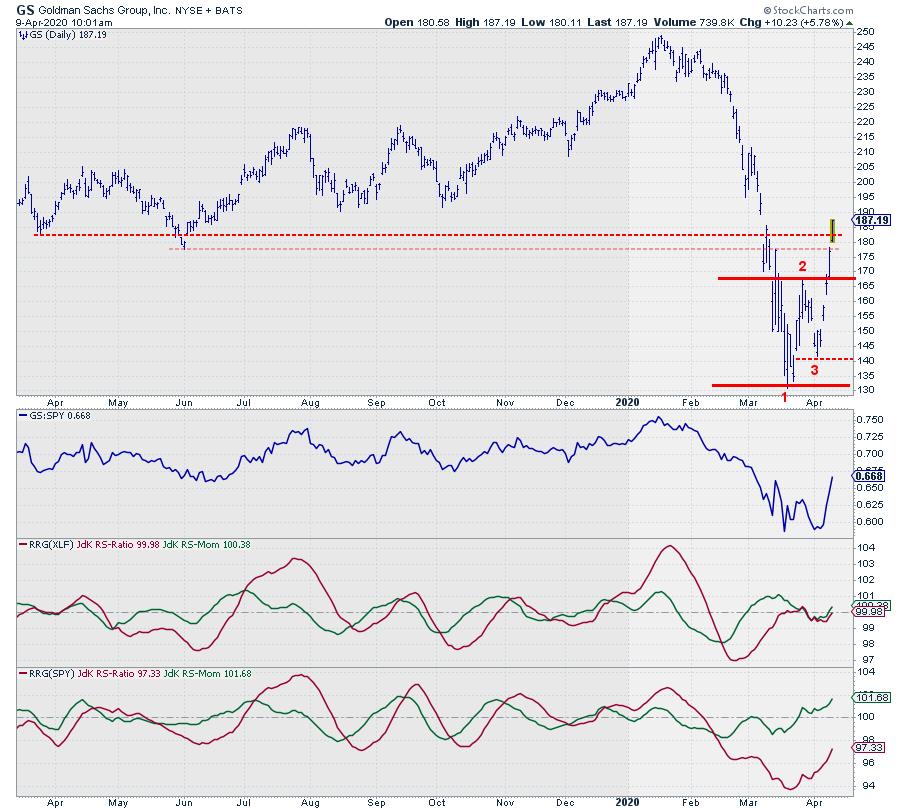
$248.94... That was the high for GS, set on Jan 17/2020. Two months later, on Mar 19/2020, a low was reached at $130.85. The stock is almost halved... so now what?
On the (weekly) RRG for US sectors, Financials is traveling well inside the lagging quadrant and pushing further into it. The daily RRG shows XLF inside improving at flat RS-Momentum, which makes it doubtful if the leading quadrant can be reached. In short, the Financials sector is not the best to invest in at the moment (pun intended).
Zooming in on the daily rotation for the individual members of the Financials sector against XLF, GS triggers the attention.
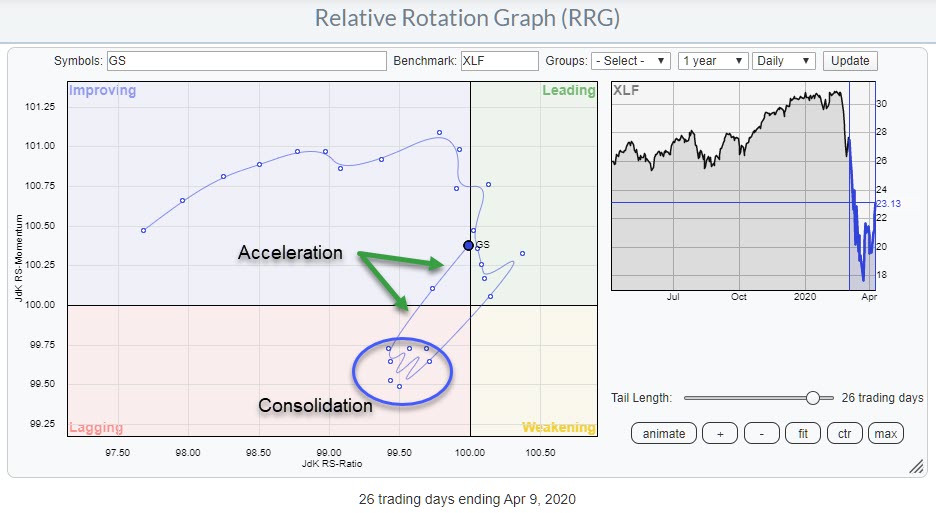
Over the last 20-30 trading days, GS rotated from improving into leading, but immediately rolled over and moved from leading straight into weakening, without touching the weakening quadrant. In there, the tail stalled and remained static, with the day-to-day observations clustered close together.
In two days, GS started to accelerate out of that cluster and is now hitting the leading quadrant again, which suggests an outperformance going forward.
The price chart at the top of this article shows the daily bars for GS with relative strength against XLF and two panes with RRG-Lines. The first one shows the RRG-Lines vs. XLF and the second pane shows the RRG-Lines vs SPY.
The RRG-Lines vs. XLF correspond with the position of GS on the daily RRG printed above. The RRG-Lines vs. SPY position GS inside the improving quadrant, traveling at a positive RRG-Heading but not yet inside the leading quadrant.
The most interesting part of the market structure since the low (1) was set is the fact that the second low (3) came in at a higher level. This indicates that buyers came in more aggressively than on March 19. Breaking above the in-between high (2) with a followthrough today, in that basis, signals that a new uptrend (higher highs and higher lows) is underway.
Obviously, there is plenty of resistance coming from former lows on the way up, but the worst seems to be over, at least for the time being.
For short-term traders, this could be a nice setup, especially when price dips back into the $170-175 support zone. Another option would be to hedge a long position in GS with a short in XLF or SPY to mitigate sector or market risk.
#StaySafe
--Julius
My regular blog is the RRG Chartsblog. If you would like to receive a notification when a new article is published there, simply "Subscribe" with your email address.
Julius de Kempenaer, Senior Technical Analyst, StockCharts.com Creator, Relative Rotation Graphs Founder, RRG Research
Please find my handles for social media channels under the Bio below.
Feedback, comments or questions are welcome at Juliusdk@stockcharts.com. I cannot promise to respond to each and every message, but I will certainly read them and, where reasonably possible, use the feedback and comments or answer questions.
To discuss RRG with me on S.C.A.N., tag me using the handle Julius_RRG.
RRG, Relative Rotation Graphs, JdK RS-Ratio, and JdK RS-Momentum are registered trademarks of RRG Research.
Julius de Kempenaer
Senior Technical Analyst, StockCharts.com
Creator, Relative Rotation Graphs
Founder, RRG Research
Host of: Sector Spotlight
Please find my handles for social media channels under the Bio below.
Feedback, comments or questions are welcome at Juliusdk@stockcharts.com. I cannot promise to respond to each and every message, but I will certainly read them and, where reasonably possible, use the feedback and comments or answer questions.
To discuss RRG with me on S.C.A.N., tag me using the handle Julius_RRG.
RRG, Relative Rotation Graphs, JdK RS-Ratio, and JdK RS-Momentum are registered trademarks of RRG Research.


