No matter what sort of general market regime we are in, there are always a few that go the other direction.
From 2017 to 2019, when the S&P surged, GE went completely the other way and more than halved. At the moment, we have a market that is flying all over the place, but is still almost 20% lower than it was two months ago. So, clearly, the majority of stocks is showing strong declines.
Not for WMT.
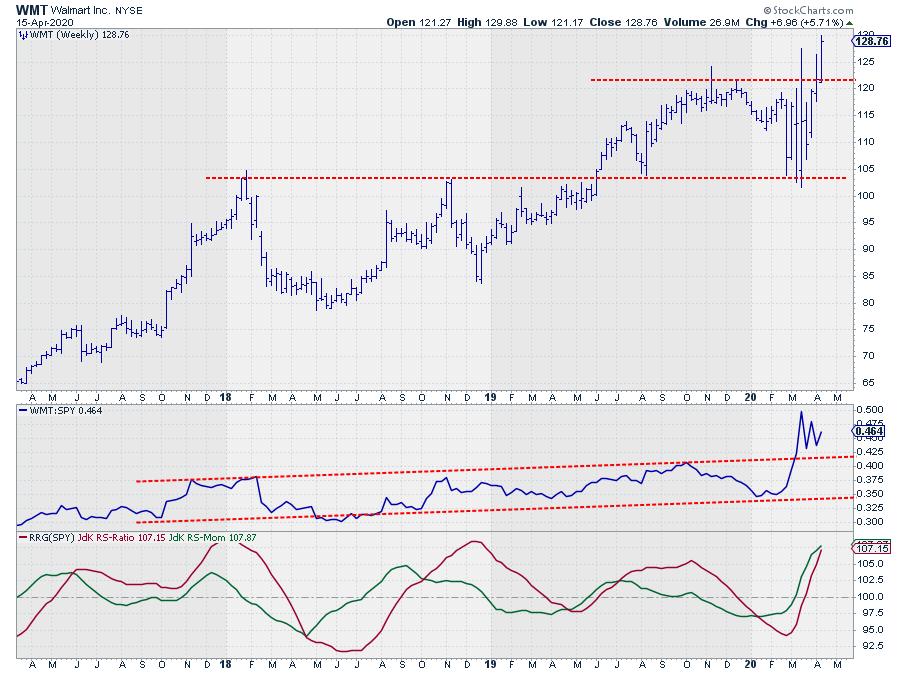
In the week of 18 Feb, when the SPY put in its high at 337, WMT actually failed to take out its previous high. In the weeks following, the WMT chart is characterized by high volatility in line with the market. But, in terms of price performance, the stock never lost more than 16% off its recent peak.
As a matter of fact, the lows of the weekly bars from 24 Feb to 16 Mar have been clustering around 102.50. This is the support level that could be established from former resistance offered by the 2018 and 2019 peaks and which was tested as support in August 2019 after breaking higher in June. It has now come back as support again in recent weeks. The ability to hold up while the market was tanking made WMT a strong outperformer at the start of the corona crash.
This strength is reflected in the sharp rise of the RS-Line, which broke out of a very slow rising channel. It's probably more of a tilted trading range. Since the initial peak following the relative break, relative strength is now consolidating.
How does that look on an RRG?
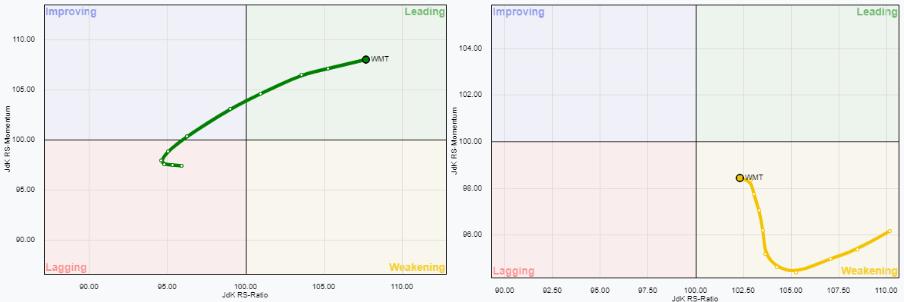
On the weekly RRG, WMT is rotating well inside the leading quadrant and still traveling at a strong RRG-Heading. On the daily RRG, the rotation dropped out of the leading quadrant into weakening, but started to curl back up again six days ago.
When this rotation on the daily RRG continues and moves back into the lagging quadrant, the odds are in favor of a further relative uptrend of WMT vs. $INDU in the coming weeks.
For the time being, Walmart is the strongest stock inside the Dow 30.
#StaySafe
My regular blog is the RRG Charts blog. If you would like to receive a notification when a new article is published there, simply "Subscribe" with your email address.
Julius de Kempenaer
Senior Technical Analyst, StockCharts.com
Creator, Relative Rotation Graphs
Founder, RRG Research
Host of: Sector Spotlight
Please find my handles for social media channels under the Bio below.
Feedback, comments or questions are welcome at Juliusdk@stockcharts.com. I cannot promise to respond to each and every message, but I will certainly read them and, where reasonably possible, use the feedback and comments or answer questions.
To discuss RRG with me on S.C.A.N., tag me using the handle Julius_RRG.
RRG, Relative Rotation Graphs, JdK RS-Ratio, and JdK RS-Momentum are registered trademarks of RRG Research.
