Recently I have been picking up some work that I had done in the past with regard to plotting (sector) breadth data on Relative Rotation Graphs.
You can review the segment in this episode of Sector Spotlight and read more about possibilities with breadth on RRGs in this article "Following Up With Breadth Data On a Relative Rotation Graph".
Energy Breadth Disconnected From Price Rotation
While reviewing the various sector breadth data-sets I noticed a disconnect or a discrepancy between the rotation of the Energy sector (XLE) on the price based RRG and the corresponding breadth data for this sector. Especially when plotted on the weekly time frame.
If you click the image at the top of this article it will open up a live version of that chart.
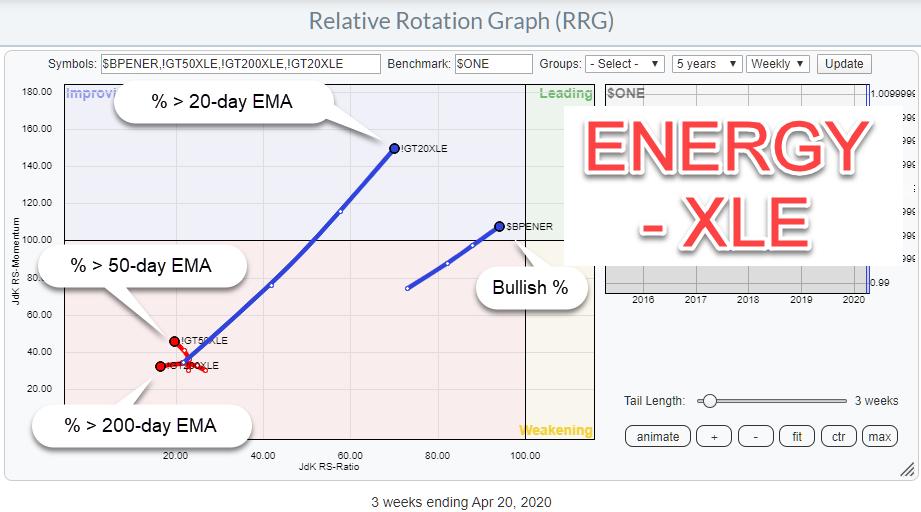
What we are looking at here are three measures of breadth based on the percentage of stocks trading above an EMA. 200-days for long term trends, 50-day EMA for medium term, and 20-day EMA for short term trend. The fourth symbol on the graph shows the Bullish percent figure, meaning the percentage of stocks inside the Energy sector that are on a P&F buy signal. All metrics are for the same sector, XLE in this case.
Most of the time these breadth measure move pretty much in line with the rotation of the sector itself on an RRG. Which is also what you would expect. When they do not do that anymore is when attention is needed. At least as a warning signal and little further investigation.
That is exactly what is going on now with the Energy sector. The RRGs below show both rotations side-by-side

Both RRGs are on a weekly time frame and what is noticeable is the rapid improvement of short-term breadth (!GT20XLE) and the Bullish percent metric.
The medium-term breadth has started to respond slowly while long-term breadth is still moving left on the RS-Ratio scale but RS-Momentum (negative) has levelled off.
On the price based RRG (left image) XLE can be seen to slowly start curling upward.
Creating similar images on a daily time frame will show you that the breadth measures are at the right hand side of the RRG and rolling over downward. This rotation is in response to the first leg up from the mid-March low which has recently stalled at the bottom of the gap area between $ 36.00 and $ 41.00.

With rotations on the weekly time frame now starting to pick up as well this makes the Energy sector interesting to watch especially as it is currently just shy of the horizontal barrier at $ 36. What is encouraging is that since setting its low, XLE has already made two higher lows with in-between higher highs which is pointing to underlying demand. Buyers are willing to come back at higher levels.
For this improvement to carry on, it is crucial, IMHO, that XLE will break above $ 36. When that happens the upside is free until $ 41 - $ 42.50.
This offers a trading opportunity with > 10% upside potential while stops can be positioned just below the breakout level to limit risk.
#StaySafe, --Julius
My regular blog is the RRG Chartsblog. If you would like to receive a notification when a new article is published there, simply "Subscribe" with your email address.
Julius de Kempenaer
Senior Technical Analyst, StockCharts.com
Creator, Relative Rotation Graphs
Founder, RRG Research
Host of: Sector Spotlight
Please find my handles for social media channels under the Bio below.
Feedback, comments or questions are welcome at Juliusdk@stockcharts.com. I cannot promise to respond to each and every message, but I will certainly read them and, where reasonably possible, use the feedback and comments or answer questions.
To discuss RRG with me on S.C.A.N., tag me using the handle Julius_RRG.
RRG, Relative Rotation Graphs, JdK RS-Ratio, and JdK RS-Momentum are registered trademarks of RRG Research.


