The Energy sector keeps coming back on my radar as a sector that's potentially turning around. The sector has been in a relative downtrend for ages already and, from a long-term perspective, things still do not look very good. However, things never look good just before or in a turnaround situation after a prolonged downtrend.
So, with that being said, Energy is still negative on LT time frames, BUT.... I keep seeing positive signs/ripples popping up at shorter timeframes and in individual stocks.
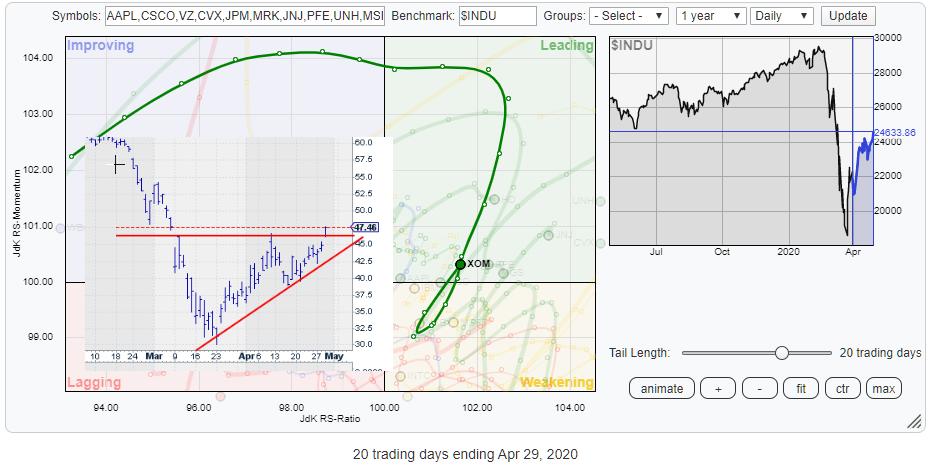
I spoke about this in this week's Sector Spotlight show, I talk about it in today's Your Daily Five show (airing 1 pm ET on 4/30) and, while I was looking at the Relative Rotation Graph for the DJ Industrials index, once again XOM popped up with an interesting rotation.
The chart above shows the RRG for all Dow stocks against $INDU, with XOM highlighted. The swift rotation back into the leading quadrant after dipping into weakening is always a pattern that interests me. The reason is that these are rotations (trends) that have completed the first leg of a move and are now setting up for a second (or third, fourth, etc).
The way I see it, that means that there is a little less risk in onboarding this trend than there was at the initial rotation.
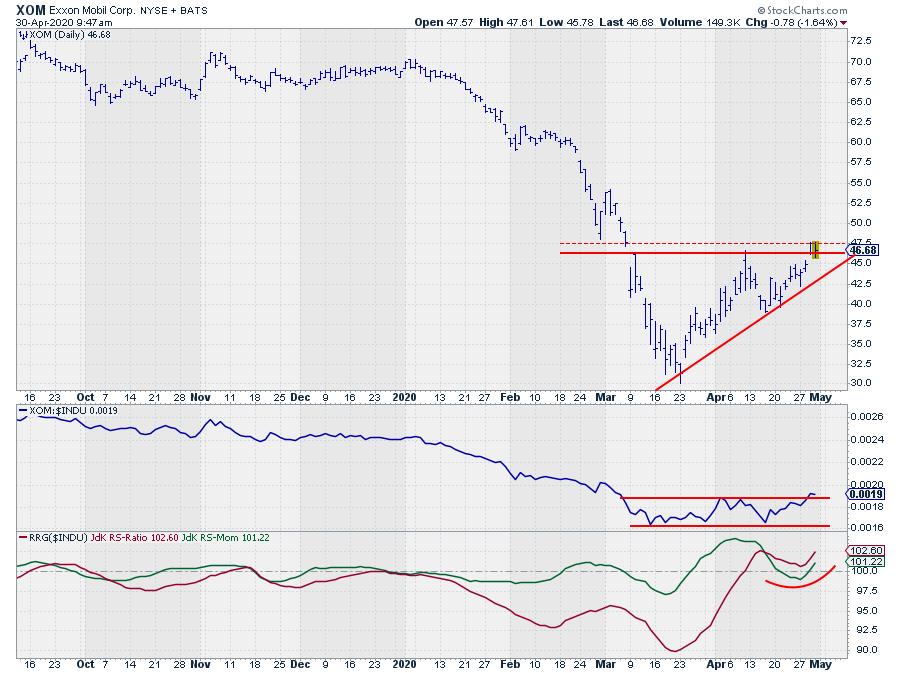
When I then check the price chart for XOM with relative strength against $INDU, a nice breakout attempt is showing up. I am watching the gap area between $46.20-$47.20 as resistance and I would like to see it cleared before jumping on a trade. However, when it does, a good risk-reward trade seems possible. There is some old resistance coming off the 2011 low around $50, but the real barrier, I think, is found near $60 where all major lows since 2012 are more or less lining up.
Such a break will undoubtedly help the rotation on the RRG push further into the leading quadrant and make XOM a very attractive stock at least for a few weeks to come!!
#StaySafe,
--Julius
My regular blog is the RRG Charts blog. If you would like to receive a notification when a new article is published there, simply "Subscribe" with your email address.
Julius de Kempenaer
Senior Technical Analyst, StockCharts.com
Creator, Relative Rotation Graphs
Founder, RRG Research
Host of: Sector Spotlight
Please find my handles for social media channels under the Bio below.
Feedback, comments or questions are welcome at Juliusdk@stockcharts.com. I cannot promise to respond to each and every message, but I will certainly read them and, where reasonably possible, use the feedback and comments or answer questions.
To discuss RRG with me on S.C.A.N., tag me using the handle Julius_RRG.
RRG, Relative Rotation Graphs, JdK RS-Ratio, and JdK RS-Momentum are registered trademarks of RRG Research.


