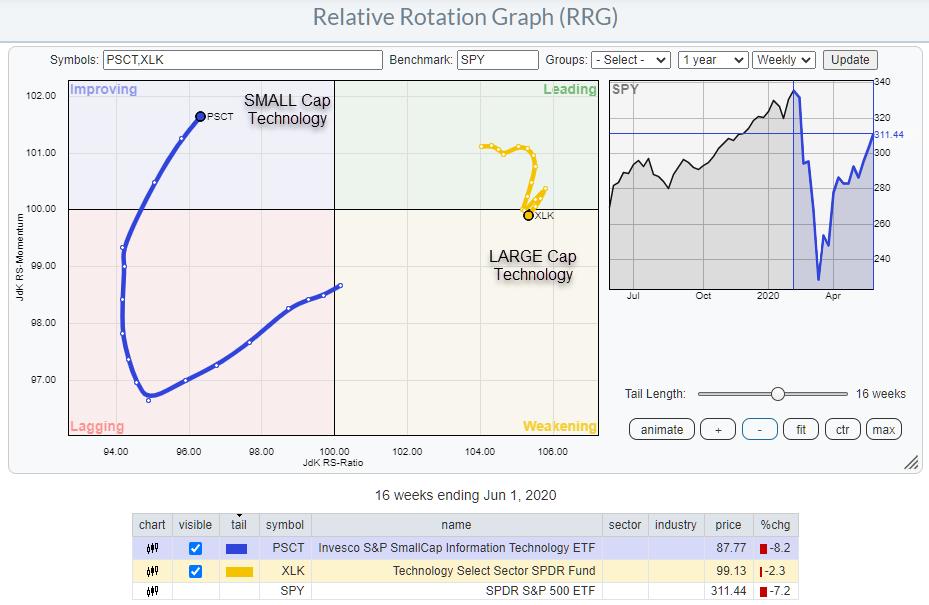
The recovery of the Technology sector out of the March low has been in line with the S&P 500, only 1.5% better. With its strong (out)performance in the run up to the February peak and the less disastrous decline into March, XLK remained at the right hand side of the Relative Rotation Graph vs SPY.
Over the last 8-10 weeks, the tail for XLK started to roll over and head downward towards the weakening quadrant. However, the long term outlook for technology is still healthy, with a strong monthly chart that is approaching a break to new all time highs.
Given the high reading on the JdK RS-Ratio scale and the short tail, combined with the weak seasonal outlook for Technology in June (see the latest episode of Sector Spotlight), that rotation can so far be classified as a temporary (relative) setback.
When I studied a Relative Rotation Graph showing the rotation for Small Cap sectors, that knowledge triggered me when I noticed the tail for PSCT, the Invesco S&P SmallCap Information Technology ETF.
In the RRG at the top of this article, I have plotted both XLK and PSCT in one image, with SPY as the benchmark. The rotation of XLK is stabilizing around 100 on the RS-Momentum scale and at a solid RS-Ratio level. But it is the rotation of PSCT that is interesting.
At the start of April, Small Cap tech stocks started to pick up some relative momentum and started heading towards the improving quadrant. That improvement is now accelerating and PSCT is now well inside improving and traveling at a positive RRG-Heading.
This suggests that a rotation out of large-cap into small-cap technology is underway and expected to continue in the next few weeks.
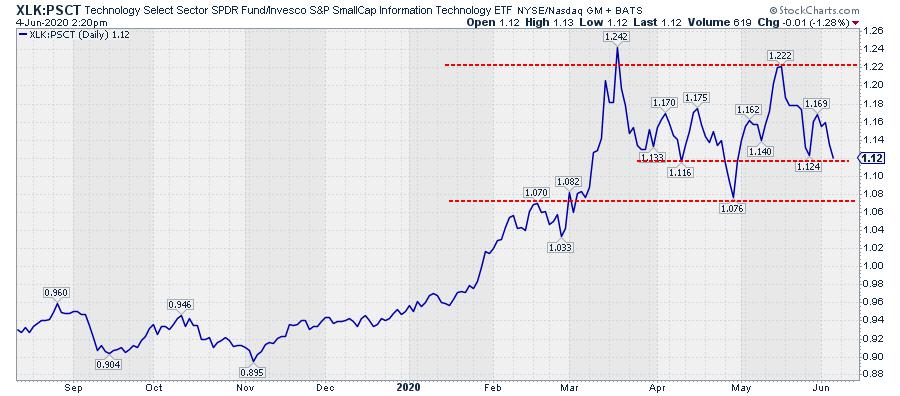
The daily ratio chart for XLK vs. PSCT shows a broad range in play since March. At the moment, the ratio is hovering above an intermediate support level. A break lower will be the trigger for more relative weakness and a continuation of the current rotation on the RRG, which favors small-cap over large-cap tech.
Shifting some holdings out of large tech into small tech seems a sensible move for now. Benefit from a strong rotational trend while still remaining invested in the sector as such!!
#StaySafe,
--Julius
My regular blog is the RRG Charts blog. If you would like to receive a notification when a new article is published there, simply "Subscribe" with your email address.
Julius de Kempenaer
Senior Technical Analyst, StockCharts.com
Creator, Relative Rotation Graphs
Founder, RRG Research
Host of: Sector Spotlight
Please find my handles for social media channels under the Bio below.
Feedback, comments or questions are welcome at Juliusdk@stockcharts.com. I cannot promise to respond to each and every message, but I will certainly read them and, where reasonably possible, use the feedback and comments or answer questions.
To discuss RRG with me on S.C.A.N., tag me using the handle Julius_RRG.
RRG, Relative Rotation Graphs, JdK RS-Ratio, and JdK RS-Momentum are registered trademarks of RRG Research.


