In yesterday's article in the RRG blog, I highlighted the Oil&Equipment Services industry as potentially interesting.
Using the scan-manager to find the members of this industry gives 78 matching results.
[group is OilEquipmentServices]
One thing that we need to take into account when using the scan-manager to dive into industry groups and find individual stocks is that these results are not limited to S&P 500 stocks, whereas the members of the sectors, as I mostly use them on the RRGs, are.
If you want to only limit your search results to include members of the S&P 500 you need to add that as a condition.
[group is OilEquipmentServices]
and [group is SP500]
This scan only shows four results; BKR, HAL, NOV, SLB
Where 78 might be a bit too broad, four might be too narrow. So we can try to tweak that universe a bit by removing the requirement to be a member of the S&P 500 and adding a few other criteria, like turnover, price, etc.
In order to filter out thinly traded stocks, I am adding the requirement that the average traded volume needs to be over 200.000 shares. That brings back the list to 42 names. Still quite a list.
Low-priced stocks can jump up and down, unexpected and uncontrollable. So I am also adding the requirement for the closing price to be above $ 10.
All in all that brings the scan to this
[group is OilEquipmentServices]
and [sma(50,volume) > 200000]
and [Close > 10]
which leads to 21 matching results, shown in the RRG below
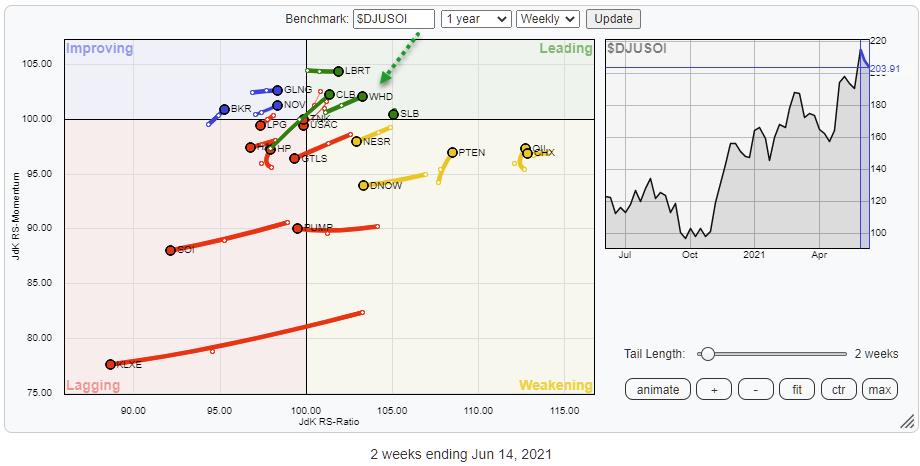
Going over the individual stocks leads to some interesting rotations inside the weakening quadrant as well as inside leading.
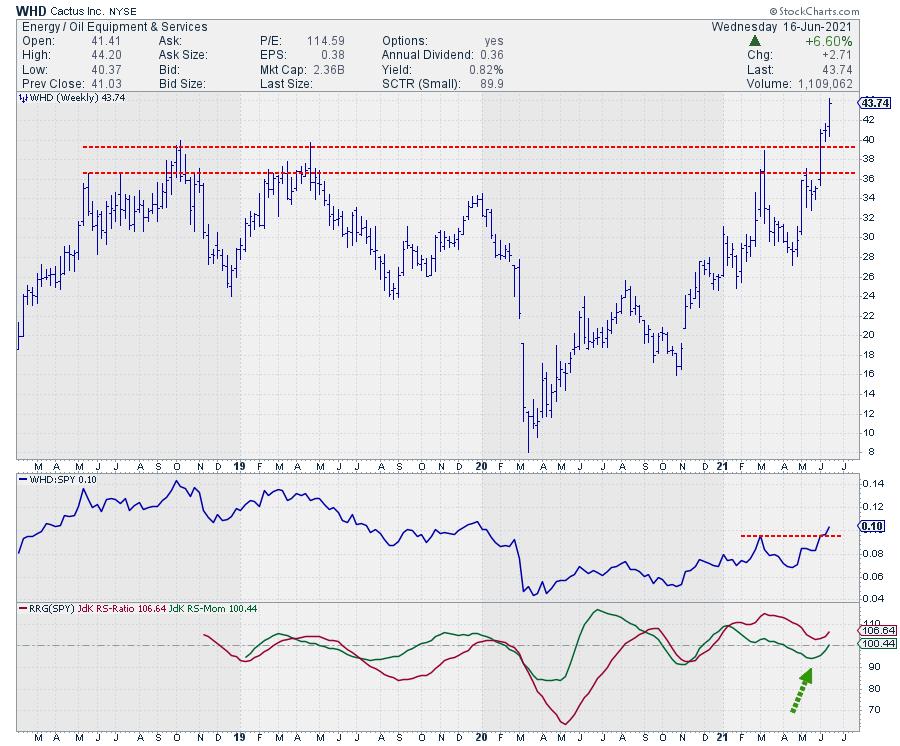
Especially WHD popped out for me when I brought up the chart at the top of this article.
It is a small-cap stock with limited, but enough to make it meaningful, history available. Since late 2018 WHD stalled and reversed in the broad resistance zone between $ 36.50 and $ 39.50.
That barrier was taken out three weeks ago and the price has held up nicely above that area, which is now expected to act as support in case of a decline.
The break also opened up the way for further upside which is now unobstructed by resistance from old highs or lows.
All in all, WHD now has plenty of upside potential and limited downside risk. Combined with a strong relative rotation this is now an interesting stock to watch IMHO.
#StaySafe, --Julius
My regular blog is the RRG Charts blog. If you would like to receive a notification when a new article is published there, simply "Subscribe" with your email address.
Julius de Kempenaer
Senior Technical Analyst, StockCharts.com
Creator, Relative Rotation Graphs
Founder, RRG Research
Host of: Sector Spotlight
Please find my handles for social media channels under the Bio below.
Feedback, comments or questions are welcome at Juliusdk@stockcharts.com. I cannot promise to respond to each and every message, but I will certainly read them and, where reasonably possible, use the feedback and comments or answer questions.
To discuss RRG with me on S.C.A.N., tag me using the handle Julius_RRG.
RRG, Relative Rotation Graphs, JdK RS-Ratio, and JdK RS-Momentum are registered trademarks of RRG Research.


