Don't Ignore This Chart!May 16, 2009 at 12:01 PM
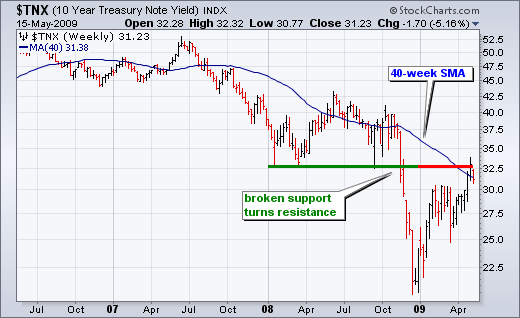
Broken support turns into resistance. This classic tenet of technical analysis is coming into play for the 10-Year Treasury Yield ($TNX). Notice that the 10-Year Treasury Yield broke support around 33-34 (3.3-3...Read More
Don't Ignore This Chart!May 14, 2009 at 11:33 AM
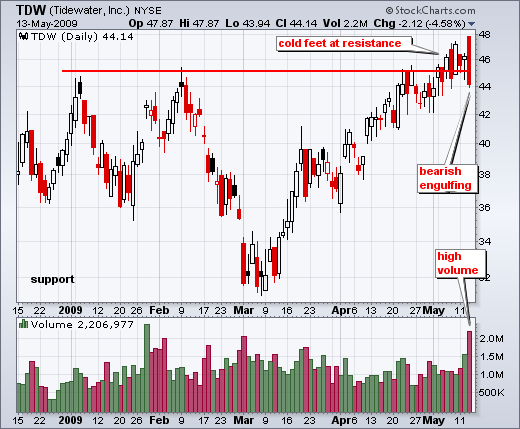
Tidewater (TDW) formed a massive bearish engulfing that engulfed the prior five candlesticks. Volume surged to its highest level since January. What's more, this is the second bearish engulfing pattern in two weeks...Read More
Don't Ignore This Chart!May 13, 2009 at 02:03 PM
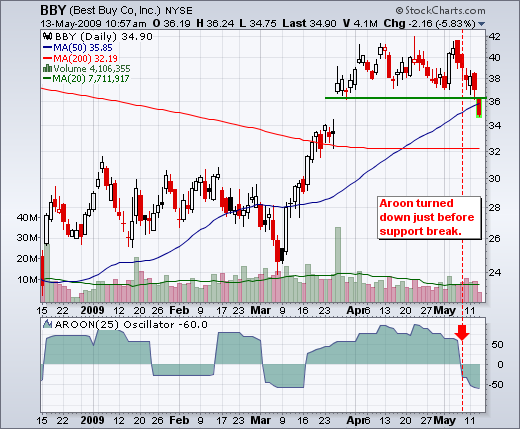
Best Buy (BBY) broke support and the 50-day moving average with a sharp decline over the last six days. Notice how the Aroon Oscillator turned negative just before this support break...Read More
Don't Ignore This Chart!May 12, 2009 at 05:33 PM
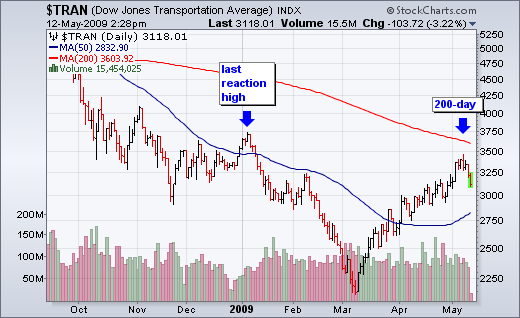
After a most impressive rally, the Dow Transports stopped just short of its 200-day simple moving average with a sharp decline the last four days. Also notice that this key average is trading below its prior reaction high (early January)...Read More
Don't Ignore This Chart!May 11, 2009 at 08:03 PM
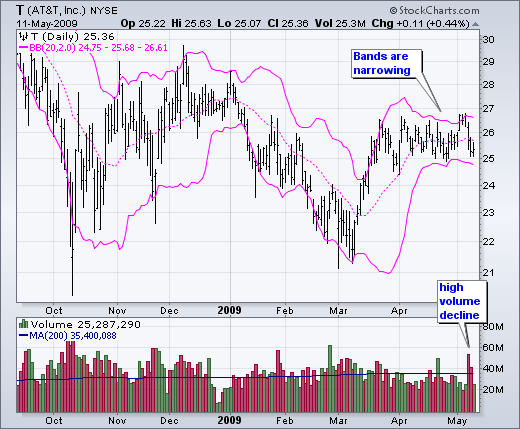
With flat trading since late March, a volatility contraction for AT&T (T) is causing the Bollinger Bands to narrow...Read More
Don't Ignore This Chart!May 09, 2009 at 05:41 AM
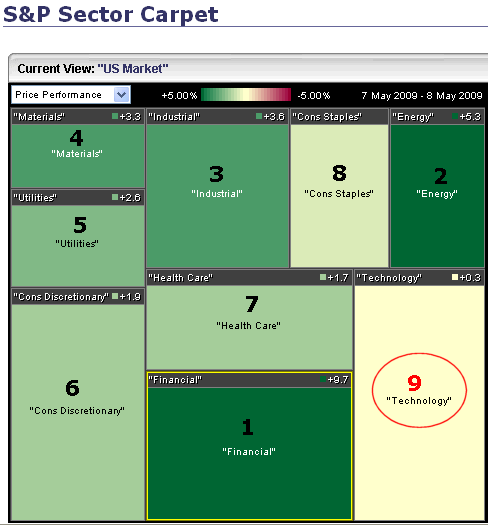
The S&P Sector Carpet shows a color-coded version of the leading and lagging sectors. Dark green sectors are leading with financial and energy showing the biggest gains on Friday. The technology was conspicuously absent from the leadership board on Friday...Read More
Don't Ignore This Chart!May 07, 2009 at 06:12 AM
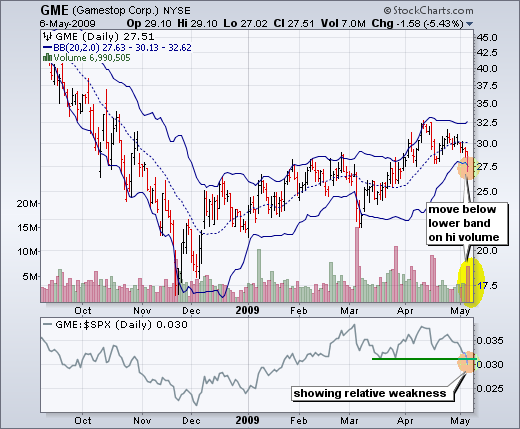
Looking through the scans page, I noticed that Game stop broke below its lower Bollinger Band with a high volume decline. Moreover, the stock is showing relative weakness as the price relative broke below its March lows...Read More
Don't Ignore This Chart!May 06, 2009 at 01:34 PM
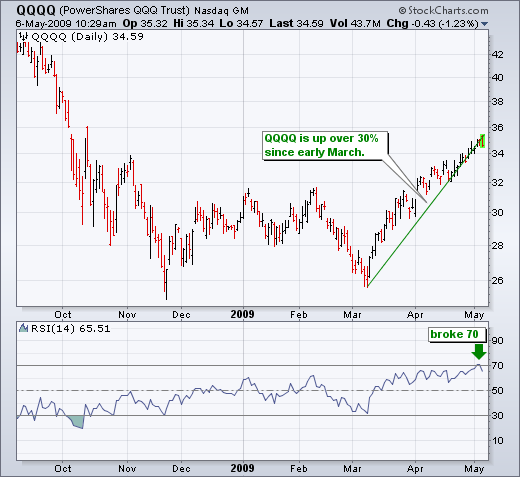
With 14-day RSI moving above 70 this week, the Nasdaq 100 ETF (QQQQ) became the first major-index ETF with an overbought reading. RSI is considered overbought when above 70 and oversold when below 30...Read More
Don't Ignore This Chart!May 05, 2009 at 12:49 PM
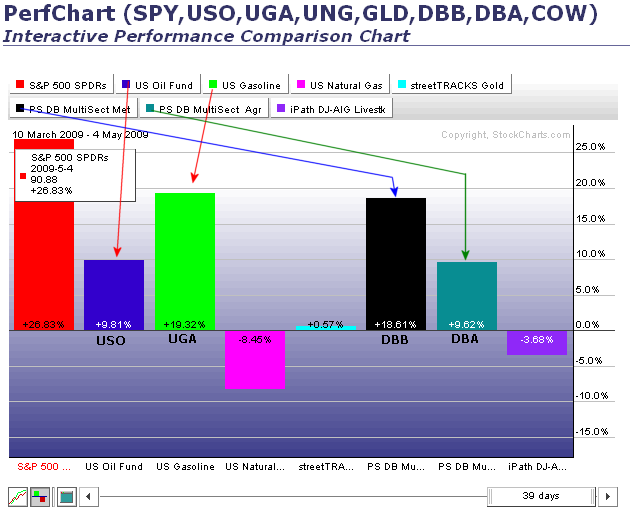
Demand for certain commodity ETFs is moving in the same direction as the stock market: UP. Economic growth translates into more demand for industrial metals (DBB), oil (USO), gasoline (UGA) and agricultural products (UGA)...Read More
Don't Ignore This Chart!May 01, 2009 at 10:48 AM
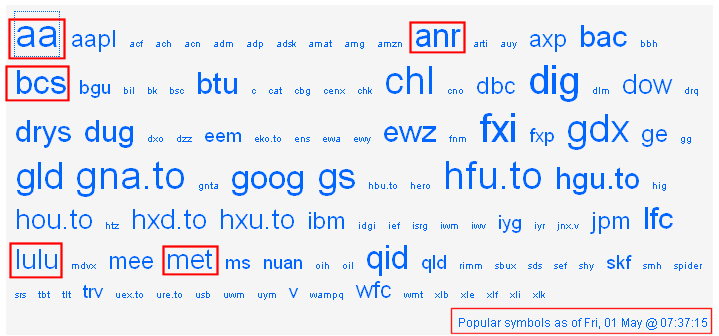
Check out the ticker cloud to see what's hot every morning. While there will always be the old standby symbols like GLD, DIG, DUG, GOOG, QID and FXI popping up, you are also likely to see some the stars d' jour...Read More