Don't Ignore This Chart!February 03, 2009 at 02:26 AM
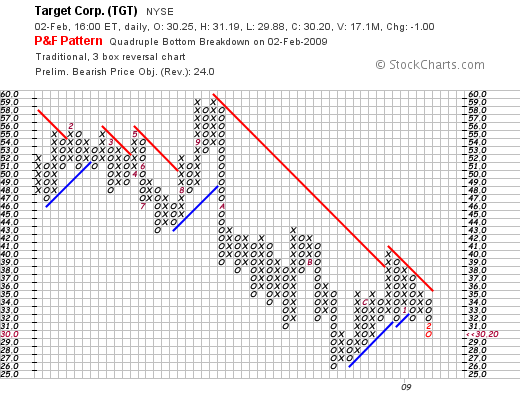
( Click here to see a live version of this chart.) Target Corp's Point and Figure chart broke below the bottom of the Quadruple Bottom Pattern that it had put in over the past 5 weeks. See the 4 "O's" in the boxes at 32? Those "O's" formed the bottom of the pattern...Read More
Don't Ignore This Chart!January 31, 2009 at 05:48 AM
( Click here to see a live version of this chart.) The Dark Cloud Cover candlestick pattern occurs when a stock that is in an uptrend has a tall hollow candle that is followed by a tall filled candle that extends below the mid-point of the first candle...Read More
Don't Ignore This Chart!January 30, 2009 at 04:42 AM
(Click on the chart for a live version) The Nasdaq Bullish Percent Index represents the percentage of Nasdaq stocks that have Bullish signals on their P&F charts. Typically, readings oscillate around 50. Readings above 60 are rare and indicate a strong rally is underway...Read More