In our note on "Sector-in Focus: NIFTY Pharma", we discussed about the NIFTY Pharmaceutical Index coming out of a multi-year year downtrend and potentially reversing its trend.
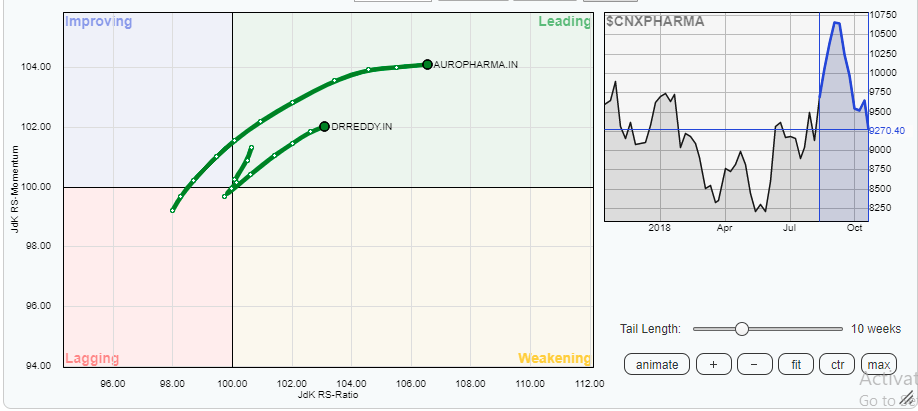
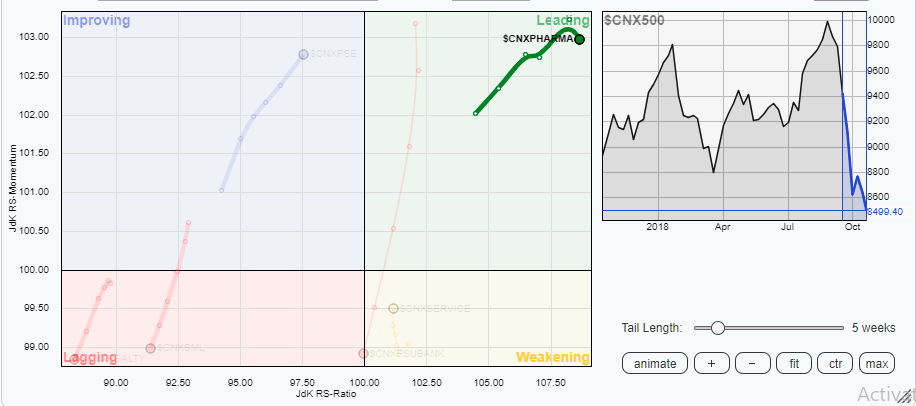 In the first Relative Rotation Graph (RRG) above, though the $CNXPHARMA has slowed down a bit on the relative momentum front, it remains firmly in the Leading Quadrant when it is bench-marked against the broader Index $CNX500. Going ahead from there, if we move to the second Relative Rotation Graph (RRG), we see that two of $CNXPharma's constituents -- Aurobindo Pharma (AUROPHARMA.IN) and Dr. Reddy's Laboratories (DRREDDY.IN) remain firmly in the Leading Quadrant when bench-marked against the NIFTY Pharmaceutical Index ($CNXPHARMA). These two stocks are likely to show relatively out-performance against both the Pharma Index as well as broader CNX500.
Aurobindo Pharma Ltd. (AUROPHARMA.IN)
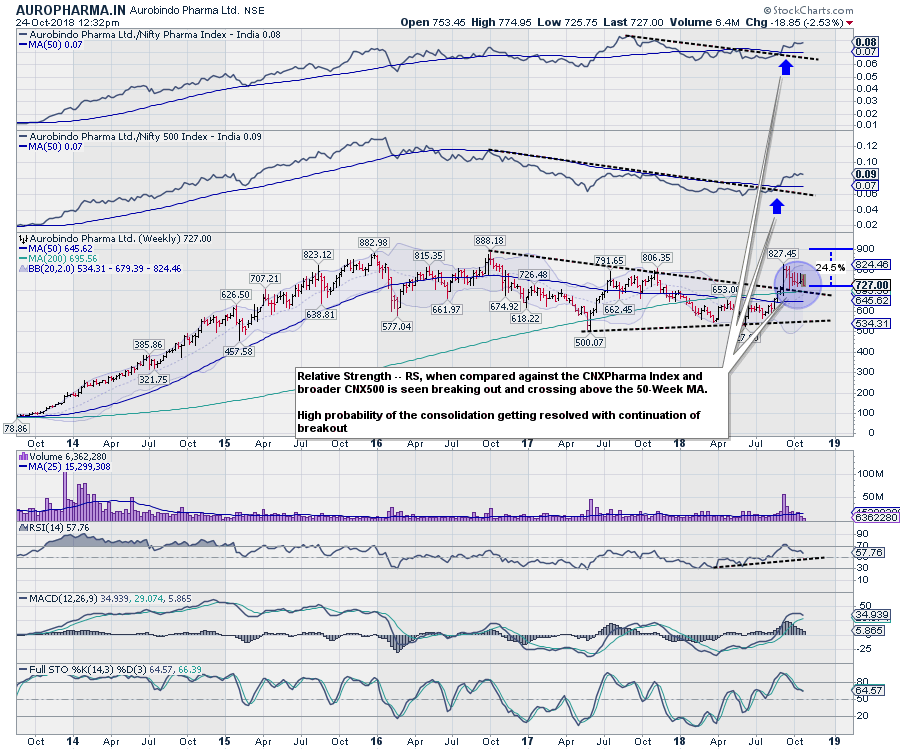 The stock marked its high at 888 in October 2015. The rally in the price got stalled as this also resulted into formation of a Double Top as the previous high of 882 was not comprehensively breached. The stock turned sideways thereafter and remained in a broad trading range. A large symmetrical triangle formation was formed which spread over more than a year and a couple of months above that. The stock attempted a breakout from this formation couple of weeks back.
As evident from the above chart, the prices suffered a classical throwback post breakout. Presently, they are seen consolidating in a small congestion area that it has formed for itself. In the meantime, the Relative Strength (RS) of the Stock when compared against CNXPharma (Nifty Pharma Index) and CNX500 (Nifty 500 - the broader market) is seen reversing its multi-month downtrend. Further confirmation came as the RS crossed its 50-Week MA. Weekly RSI is seen marking higher bottoms. MACD and PPO remains positive. Strong support in form of a 200-Week MA exists at 695
We see this stock relatively outperforming both the Nifty Pharma Index and CNX500 (broader markets). Some upside potential of ~24% is seen from current levels. Any move below 680 will be negative for the stock.
Dr. Reddy's Laboratories (DRREDDY.IN)
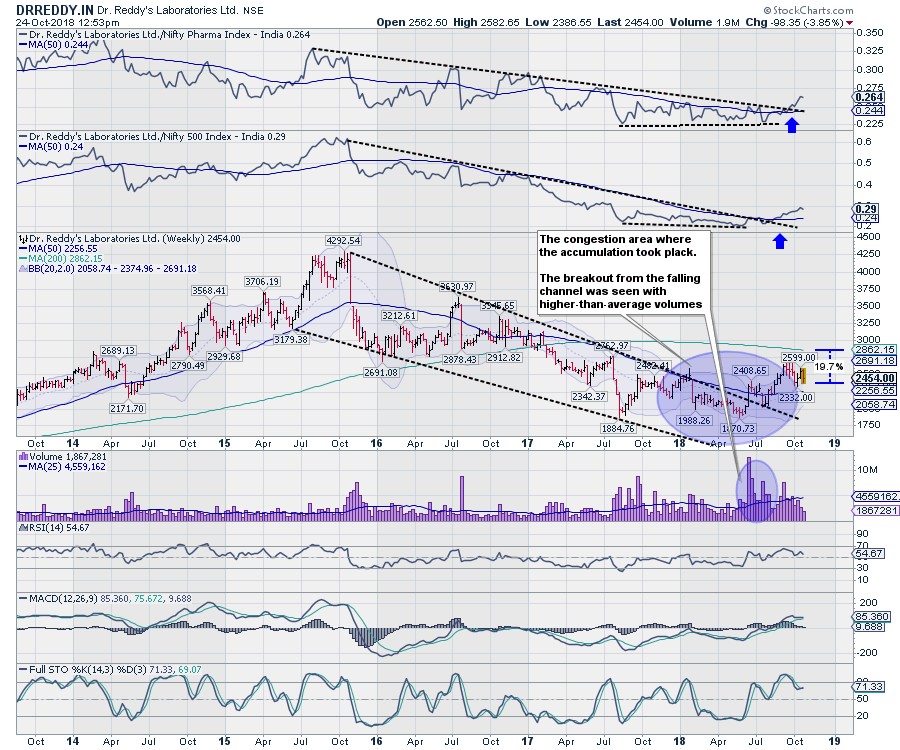 The stock formed its high at 4292 in October 2015 and since then it has remained under corrective decline. It remained in a falling channel forming lower tops and bottoms. The stock tested its lows in the 1870-1885 range and saw some ranged movement in a defined range. The downside was stalled in the 1870-1925 zone. After the accumulation that was seen, the stock attempted a breakout from a multi-year corrective falling channel. After suffering a classical throwback and returning to the levels from where it broke out, the stock has resumed its up move.
The confirmation to this channel breakout has come from more than one places. First, it came from Volumes. At the time of breakout, the Volumes remained higher-than-average. Further to this, the Relative Strength (RS) of DRREDDY.IN when compared against CNXPHARMA (Nifty Pharma Index) and the broader CNX500 (Nifty 500) turned upward and reversed its multi-year downtrend. The confirmation to this reversal came when the RSI crossed its 50-Week MA. The stock is seen firmly placed in the Leading Quadrant on Relative Rotation Graph (RRG) when bench-marked against CNXPharma. Stock is likely to pullback to its 200-Week MA.
The stock has upside potential of ~19% from here. Any move below 2200 will be negative for the stock.
Milan Vaishnav, CMT, MSTA
Consulting Technical Analyst
www.EquityResearch.asia
------------------------------------------------------------------------------------------------------------------------------------
Disclosure pursuant to Clause 19 of SEBI (Research Analysts) Regulations 2014: Analyst, Family Members or his Associates holds no financial interest below 1% or higher than 1% and has not received any compensation from the Companies discussed.


