For yet another week, the markets took no directional call, going on to end the week with modest gains. The NIFTY remained within a broadly-defined range throughout the week, making some gains towards the end that halted near the 200-DMA. On the weekly charts, the index continued with its sideways move, ending once again above the 50-Week Moving Average, which is presently at 10805. Though it took no major directional call, the NIFTY ended with gains of 71.85 points (+0.67%) on weekly basis.
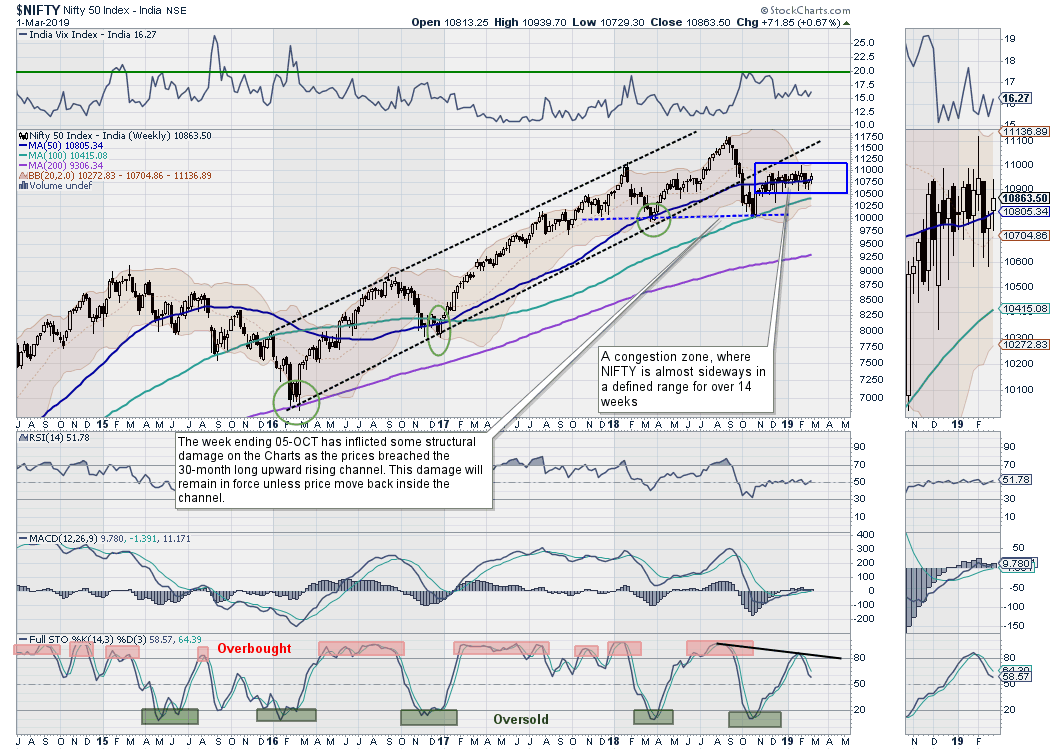
As mentioned in our previous weekly note, the NIFTY has been flirting with its 50-Week MA for over 15 weeks now; the index is engaged in a prolonged sideways move, which has resulted in the formation of a congestion zone for the index.
We expect a stable start to the week, which begins Tuesday following an extended weekend. Having said this, it is important that the NIFTY makes a decisive move on the weekly timeframe charts in order to avoid any weakness from creeping in. Some weakness, though temporary, may become apparent if the prolonged sideways movement loses its significance. On the daily chart as well, the NIFTY has yet to make any decisive move and remains in a broad trading range.
The coming week is expected to remain range-bound, with the levels of 10960 and 11080 acting as immediate resistance points. Supports come in at the 10710 and 10610 levels.
The Weekly RSI is 51.7778; it remains neutral and shows no divergence against the price. The weekly MACD is bullish and is trading above its signal line. It is important to note that the trajectory of this indicators is so flat that, despite remaining above its signal line for over 9 weeks, NIFTY has registered gains of just 0.03% during this time frame. No significant formation has emerged on candles.
The pattern analysis of the weekly charts shows a narrow congestion zone being formed around the 50-Week Moving Average. The NIFTY has been moving around this important area for 15 weeks and has failed to make any directional move on either side. The prevailing geopolitical tensions across the borders have de-escalated, which may result into some fewer volatile moves in the markets. However, unless the NIFTY makes a decisive move beyond the 50-Week MA, it continues to remain vulnerable to profit-taking bouts from higher levels. Any slip below this level again might result in some more weakness for the markets.
We recommend continuing to adopt highly stock-specific approaches to the markets in the coming week. Exposures should be kept at modest levels as the markets remain comparatively trend-less in the immediate short-term time horizon. A cautious outlook is advised for the coming week.
Sector Analysis for the Coming Week
In our look at Relative Rotation Graphs, we compared various sectors against the CNX500, which represents over 95% of the free float market cap of all the stocks listed.
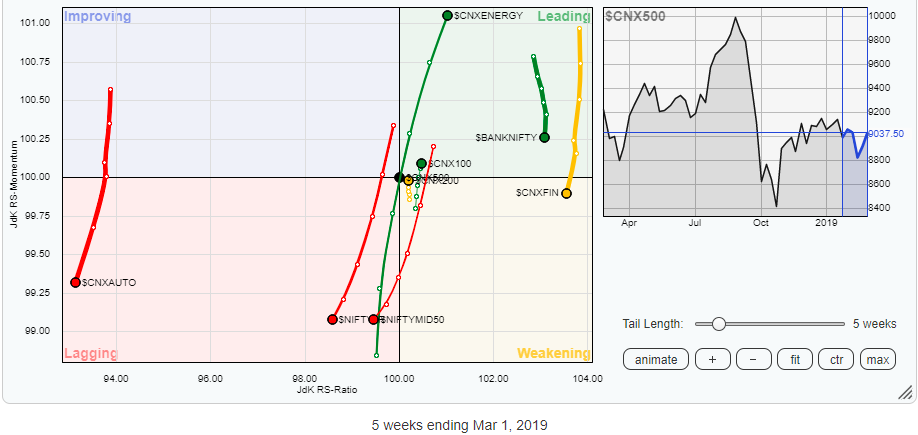
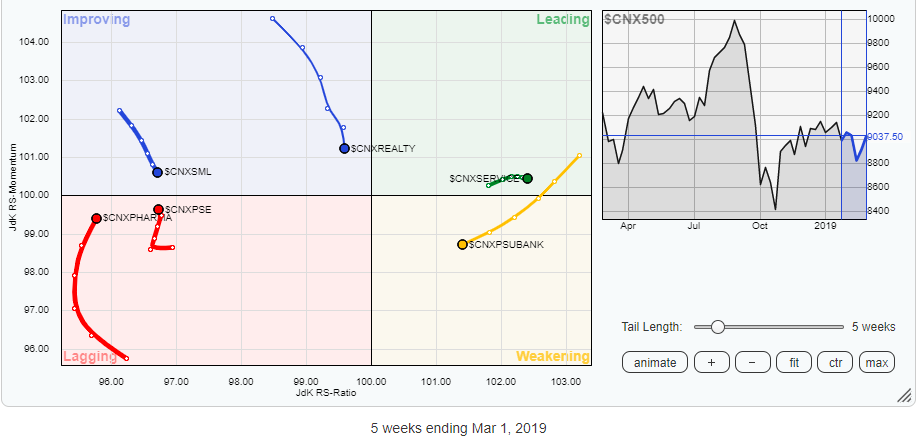
While reviewing Relative Rotation Graphs (RRG), it can be observed that the Energy and IT packs, along with the CNX100 and CNX200, are likely to relatively outperform the broader markets. The Energy and IT indexes are advancing firmly in the leading quadrant. The CNX100 index, though it remains in the leading quadrant, needs to step up its momentum in order to make larger moves. The CNX200 index remains in the weakening quadrant, but it is moving higher and attempting to enter the leading quadrant. The CNX Service sector index is in the leading quadrant, but it does not appear to be making any major moves.
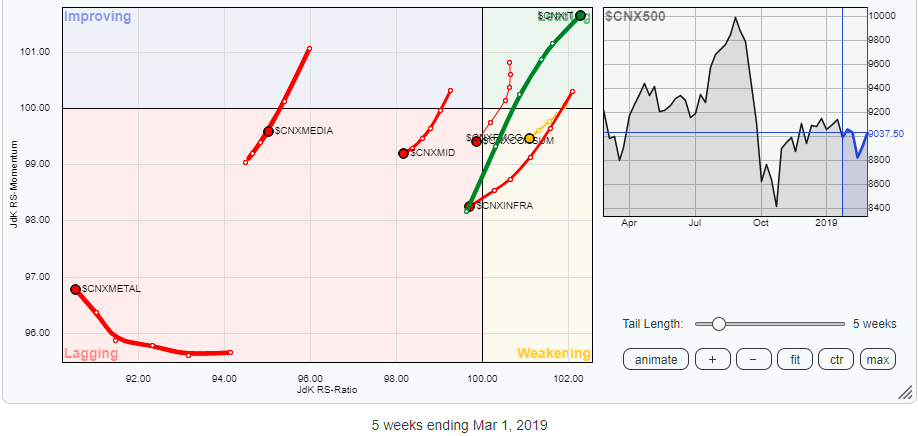
The rest of the indexes, such as NIFTY Auto, BankNIFTY, Realty, PSUBanks, Small Caps, NIFTY MID50, CNXMID, INFRA, Consumption, NIFTY Next50 and Financial Services Index, are seen steadily losing on the relative momentum front while being positioned at different places on the Relative Rotation Graph.
The Metal, Pharma and PSE packs are moving higher and improving their momentum while still inside in the lagging quadrant. These groups may display good resilience to downsides, if there is any, while consolidating their position through offering stock-specific performances.
Important Note: RRG™ charts show you the relative strength and momentum for a group of stocks. In the above chart, they show relative performance as against the NIFTY500 Index (Broader Markets) and should not be used directly as buy or sell signals.
Milan Vaishnav, CMT, MSTA
Consulting Technical Analyst
www.EquityResearch.asia


