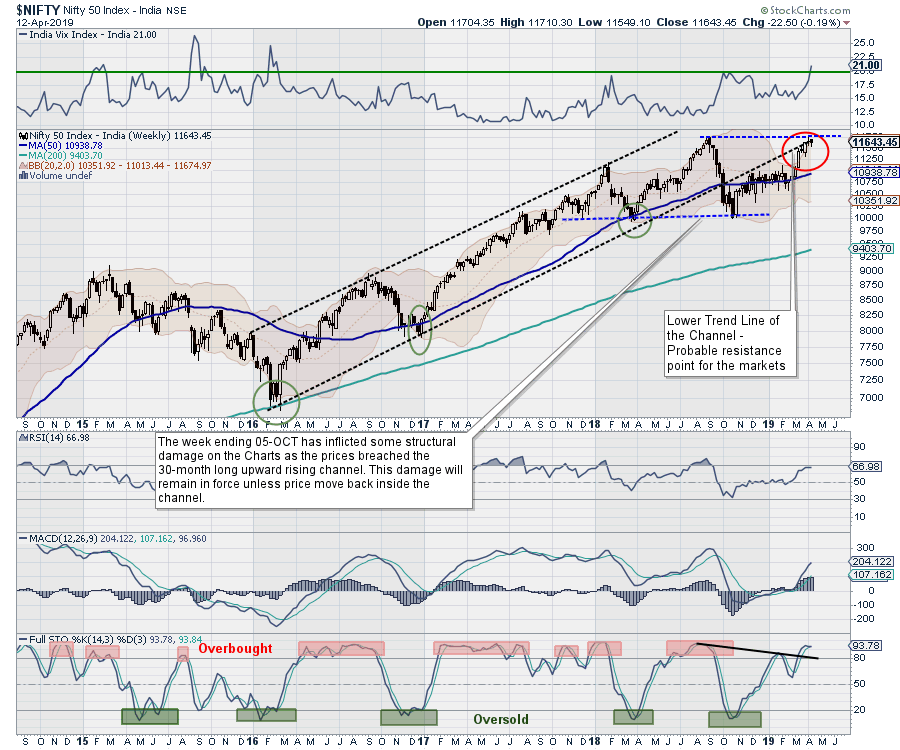
This was the second week in a row where the Indian equity markets did not make any significant directional move. The week that went by remained particularly volatile, as the market oscillated back and forth on each side in a defined range while continuing to resist to the lower trend line of the rising channel it breached on the downside in late 2018. While heading nowhere, the benchmark index NIFTY50 ended with a net weekly loss of 22.50 points (-0.19%).
The coming week will be a very short 3-day week. Wednesday and Friday are trading holidays on account of Mahavir Jayanti and Good Friday respectively. Looking beyond the shortness of the week, however, the markets are ringing some serious warning bells that deserve special scrutiny.
The Volatility Index (VIX), also referred to as the “fear gauge” or “fear index,” typically has strong negative correlation with the benchmark index. However, during recent weeks, this relation has been thrown off-balance, as we have seen that both NIFTY and VIX are rising together. Whenever this has happened in past, it has spelled trouble for the markets in the following weeks. This week, the VIX has gained 14.56% to 21. Presently, the VIX is at levels that have only been seen before in early 2016.
The level of 11760 will continue to pose stiff resistance to the markets going into the coming week. Supports will come in lower at 11550 and 11410.
The weekly RSI is 66.9758; it remains neutral and shows no divergence against the price. The weekly MACD is bullish and trades above its signal line. An Engulfing Bearish candle has occurred. Though this is not a large candle, it certainly depicts discomfort of the market participants at current levels.
We have seen defensive sectors rotating favorably over the past couple of days; this trend is likely to continue in the coming week as well. We suggest staying away from creating any aggressive positions and remaining moderately invested in the defensive stocks. Given the ongoing general elections, we will see markets continue to exhibit a tentative approach over coming days. A cautious outlook is advised for the coming week.
Sector Analysis for the Coming Week
In our look at Relative Rotation Graphs, we compared various sectors against CNX500, which represents over 95% of the free float market cap of all the stocks listed.
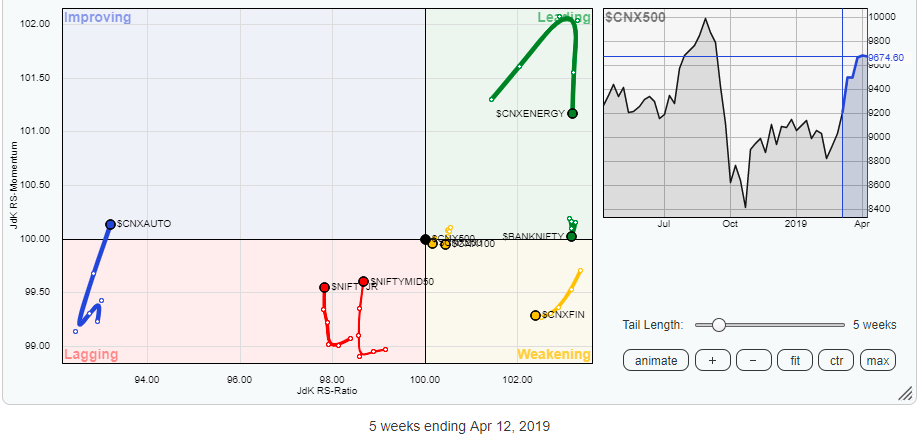
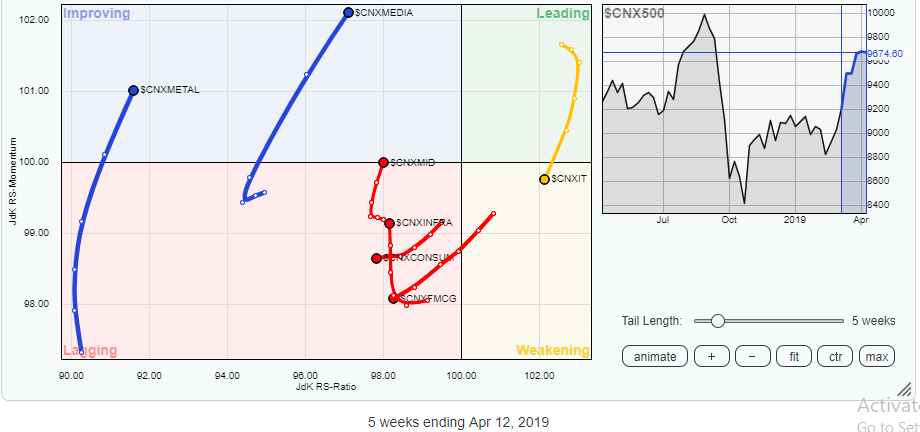
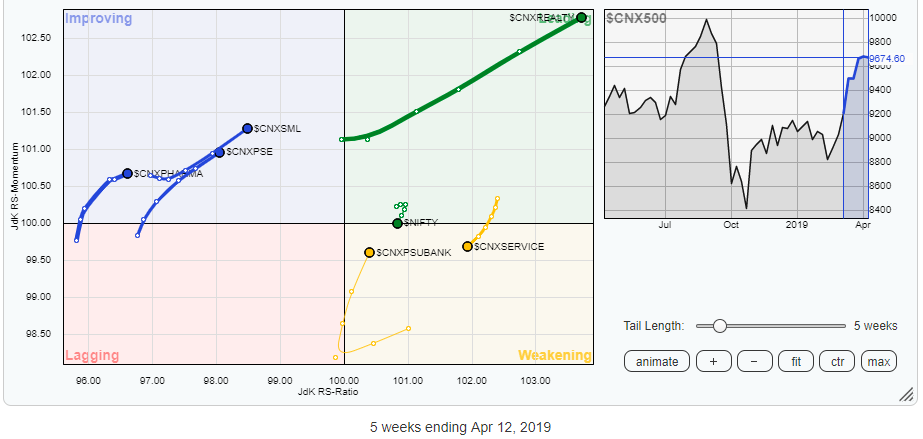
The review of Relative Rotation Graphs (RRG) shows that, in the coming week, the bulk of the action is likely to remain concentrated among the Pharma, IT, Media, Metal and Realty packs. While Realty remains firmly placed in the leading quadrant, the remaining groups are in the improving quadrant. However, their relative momentum remains strong and intact when compared to broader markets. The Auto index has crawled into the improving quadrant.
The Energy index is in the leading quadrant, but it is losing its relative momentum, as is the BankNifty Index. The IT pack has slipped in the weakening quadrant. The PSU Bank group is sharply reversing its trend and improving its momentum, but it still remains in the weakening quadrant alongside Services and the Financial Services Index.
Meanwhile, the Consumption and FMCG groups continue to slide further in the lagging quadrant. The Infrastructure index also remains in the lagging quadrant, but it is sharply improving its relative momentum when benchmarked against the broader markets.
Important Note: RRG™ charts show you the relative strength and momentum for a group of stocks. In the above chart, they show relative performance as against the NIFTY500 Index (Broader Markets) and should not be used directly as buy or sell signals.
Milan Vaishnav, CMT, MSTA
Consulting Technical Analyst
www.EquityResearch.asia