In the previous weekly note, we had raised concerns as the NIFTY had slipped below its 20-Week MA and the volatility index, VIX, traded at a multi-month low. It was expected that the volatility was likely to increase while there are chances of markets drifting lower. The week that went by saw the index trading precisely on the anticipated lines. After staying positive for most of the week, the NIFTY's dismal performance on the last trading day of the week saw it ending with losses on a weekly note. The headline index ended the week losing 133.25 points (-1.15%). 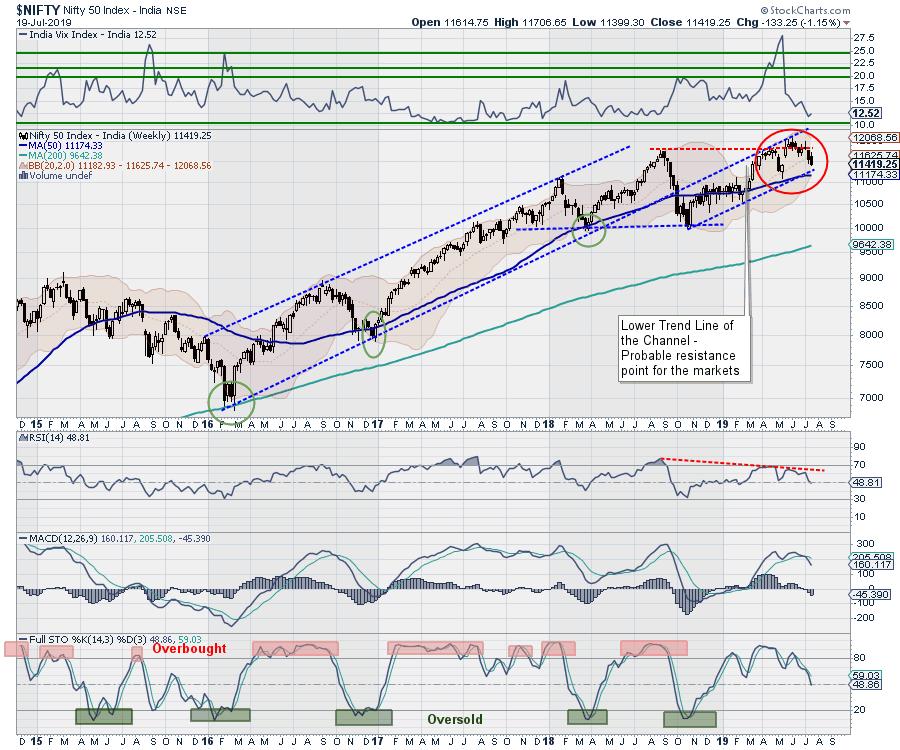
The coming week has the markets precariously poised once again. The India VIX has risen just 4.31% to 12.52 and continues to remain at one of its lowest levels of recent times. Although the NIFTY has rested on pattern support which in the form of a 9-month long rising trend line; this is the lower trend-line of the secondary channel that the NIFTY has formed since October 2018. On the other hand, any breach of this level will see the possibility of NIFTY testing its 50-Week MA.
The coming week may see a mild technical pullback given the fact that the markets are once again modestly oversold. However, the zone of 11375-11425 will be a crucial area to watch, and any breach of this zone will see the markets losing some more ground. We will have the levels of 11480 and 11590 while supports will come in at 11310 and 11180.
The Relative Strength Index (RSI) on the weekly chart is 48.8153. The RSI has marked a fresh 14-period low, which is bearish, and it also shows a bearish divergence against the price. The RSI has marked a new 14-period low while the NIFTY has not done so. The weekly MACD stays bearish and trades below its signal line.
The NIFTY had formed a secondary upward rising channel after it breached the primary 30-month-long rising channel in October 2018. The pattern analysis of the weekly charts shows that as of today, the index has taken support on the lower trend-line of this secondary channel.
The coming week will also see the expiry of the current derivative series. We expect the trade to remain dominated with rollover-centric activities. Much short-covering and long unwinding were seen over the past couple of days, and the markets remain relatively light as compared to the previous month. There is a room for a mild technical pullback in the markets. However, this pullback, if at all it occurs, would be just a swing trade and should not be chased. We recommend keeping exposures at modest levels and approaching the week with a good amount of caution.
In our look at Relative Rotation Graphs, we compared various sectors against CNX500 (NIFTY 500 Index), which represents over 95% of the free float market cap of all the stocks listed.
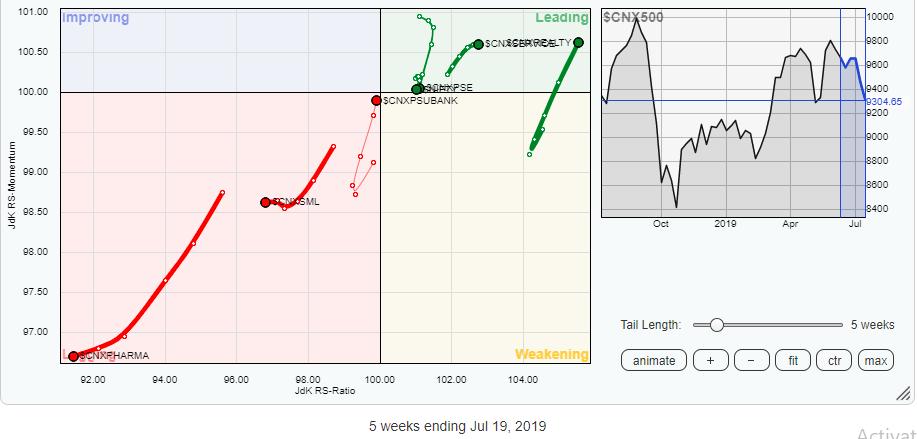
The review of Relative Rotation Graphs (RRG) shows sharp polarity between the sectors that are either likely to remain resilient or relatively outperform the broader markets and those which are expected to remain weak.
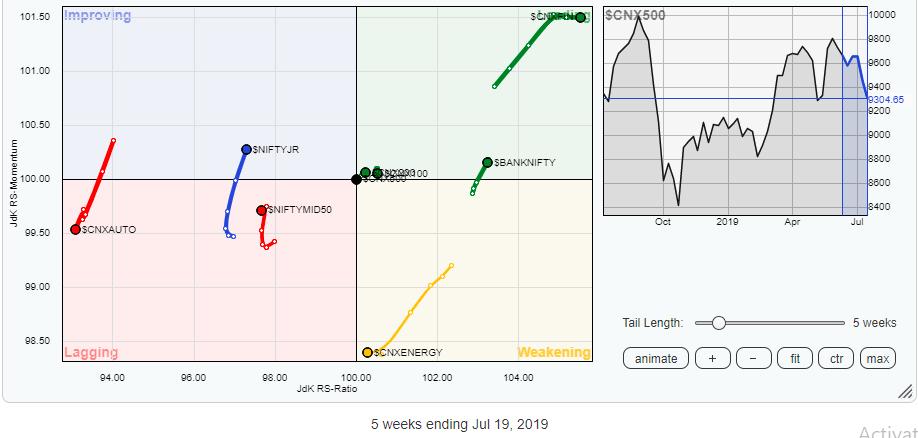
The BankNIFTY, Financial Services, Services Sector, Infrastructure, and the Realty Index are in the leading quadrant and are likely to show resilience to any downsides in the markets. In the event of any up-move, they may relatively outperform the markets in general. The CPSE index is also in the leading quadrant, but it is heading down while steadily losing its relative momentum.
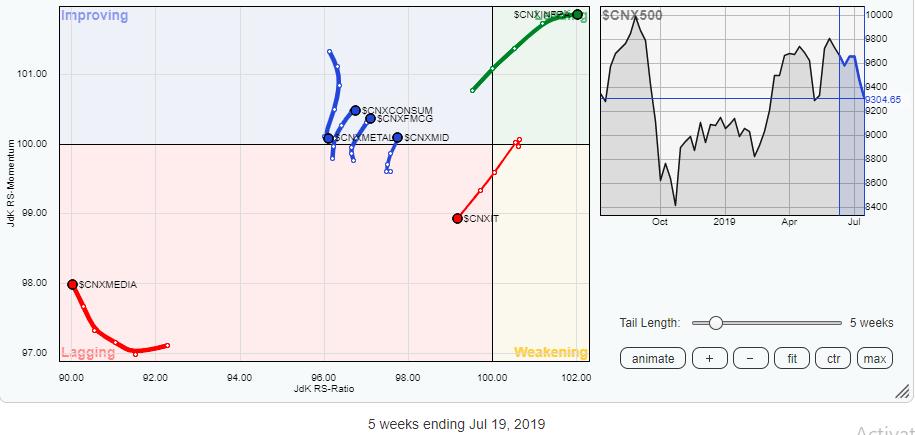
Along with the above sectors, the Consumption and FMCG index are also moving higher in Improving quadrant. The PSU Banks and the Media Index are seen improving their relative momentum while continuing to remain in the lagging quadrant.
Apart from this, the IT, Pharma, Auto and Metal Indexes are seen continuing to lost relative momentum. These packs are likely to relatively under-perform the broader markets.
Important Note: RRG™ charts show you the relative strength and momentum for a group of stocks. In the above Chart, they show relative performance against NIFTY500 Index (Broader Markets) and should not be used directly as buy or sell signals.
Milan Vaishnav, CMT, MSTA
Consulting Technical Analyst


