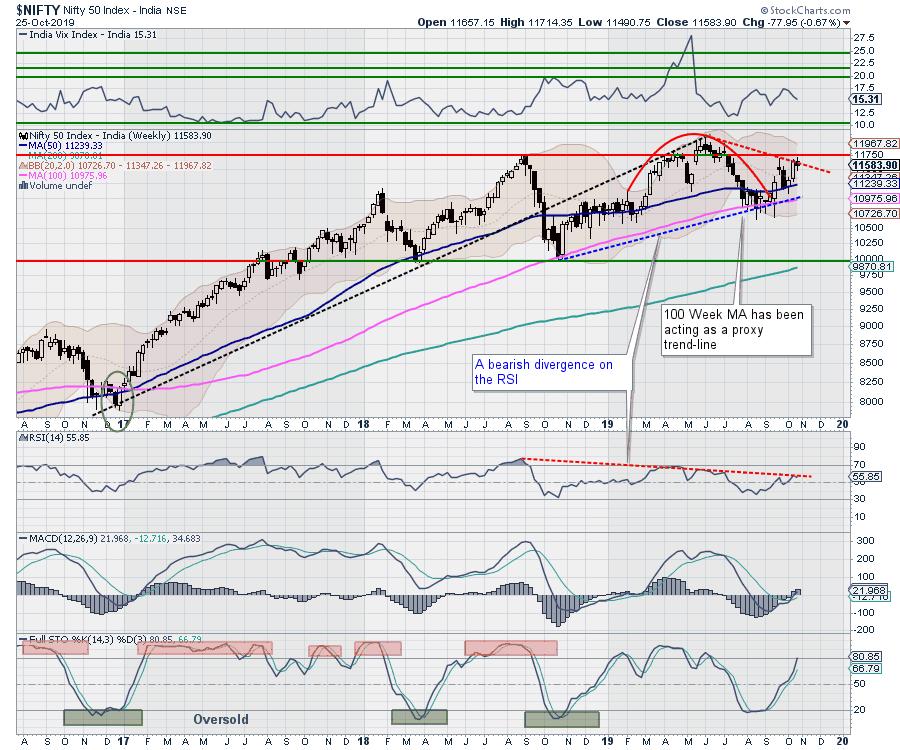
In the previous weekly note, we had mentioned the possibility of the NIFTY consolidating in a defined range while having a limited upside. Though it traded in line as anticipated, the NIFTY spent a significant part of the week resisting and consolidating near the 11700-level. While continuing to stay above the critical supports, the headline index remained flat and ended with a weekly loss of 77.95 points (-0.67%).
The coming week is likely to trade on similar lines. Expect a very short Mahurat trading session on Sunday; the following week is practically a truncated one, with Monday being a trading holiday. The NIFTY has resisted to a falling trend line drawn from the high point near the 12100-mark; it has stayed below this pattern resistance as of now. Apart from this, the zone of 11700-11750 will continue to remain a problematic area, one which the markets will have to navigate on the upside to resume its up move.
The Mahurat session was mostly one of a symbolic nature, as expected. Apart from this, we may see the markets remaining range-bound in the coming week. All the up moves, if there are any, will continue to find stiff overhead resistance.
The coming week will see the levels of 11750 and 11840 acting as resistance, while supports come in at 11535 and 11410. The Relative Strength Index (RSI) on the weekly chart is 55.8451; it remains neutral and does not show any divergence against the price. The weekly MACD is still bullish and trading above its signal line. No significant formations were observed on the Candles.
The pattern analysis on the weekly charts shows an interesting picture. The NIFTY has resisted to the falling trend line drawn from near the high point of 12100. This pattern resistance means the NIFTY is still vulnerable at higher levels, unless it can take out the 11750 level and stay above it. On the other hand, the RSI, which is the leading indicator of the markets, continues to show the formation of lower tops and presently remains trapped in a formation.
Broadly speaking, the NIFTY is not able to sustain at higher levels and will have to convincingly move past the zone of 11700-11750. Unless these levels are taken out, the markets will continue to remain vulnerable at higher levels. All the up moves so far over the previous days have come in on the back of short-covering, while the support from hardcore buying is missing. Unless we see the up moves fueled by buying, the higher levels will keep getting sold. We recommend staying highly stock-specific and avoiding aggressive exposures. There are higher chances that the markets remain highly stock/sector-specific over the coming week.
Sector Analysis for the Coming Week
In our look at Relative Rotation Graphs, we compared various sectors against CNX500 (NIFTY 500 Index), which represents over 95% of the free float market cap of all the stocks listed.
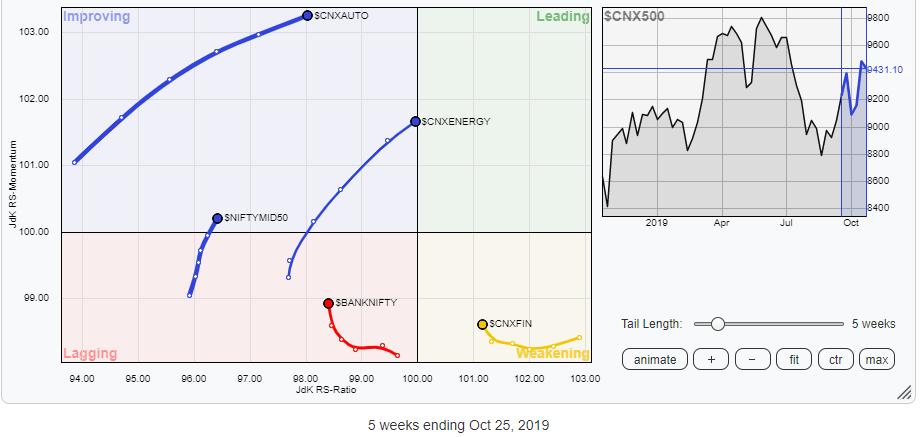
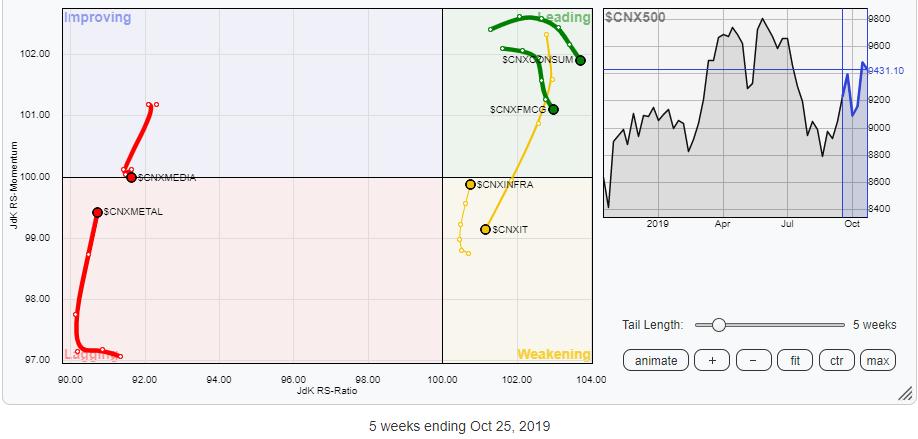
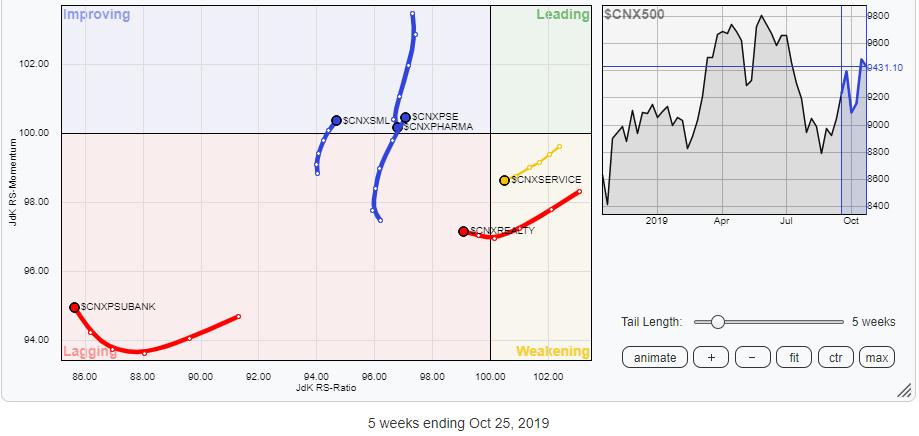
Our review of Relative Rotation Graphs (RRG) shows that FMCG and Consumption indexes continue to remain in the leading quadrant. Despite stalling momentum, they may continue to relatively out-perform the broader markets. Along with these groups, the SmallCap and the CPSE indexes seem to have bottomed out, entering the improving quadrant. The Infrastructure pack is also showing a steady improvement in its relative momentum; it looks to be in the process of getting bottomed out.
The Pharma index has seen a sharp fall in the momentum and has stalled its rally over the past couple of weeks. The BankNIFTY, Financial Services, Realty and Service Sector indexes and the PSU Banks are likely to relatively underperform the broader markets. The Energy and the Auto groups have kept their momentum intact and are expected to put up a resilient performance.
Important Note: RRG™ charts show you the relative strength and momentum for a group of stocks. In the above chart, they show relative performance against NIFTY500 Index (Broader Markets) and should not be used directly as buy or sell signals.
Milan Vaishnav, CMT, MSTA
Consulting Technical Analyst,


