After healthy consolidation around the 12000 level over the past couple of weeks, the NIFTY has attempted to break above a year-long secondary trend that it was in by ending the week with gains. Throughout the week, the markets pushed hard to breach the double-top resistance on the shorter-term charts even as they continued to consolidate fiercely. The last trading day of the week saw some paring of gains ahead of expected weak GDP data. However, despite this, the headline index ended the week with net gains of 141.65 points (1.19%). The Indian VIX has further cooled off by 6.56% to 13.90.
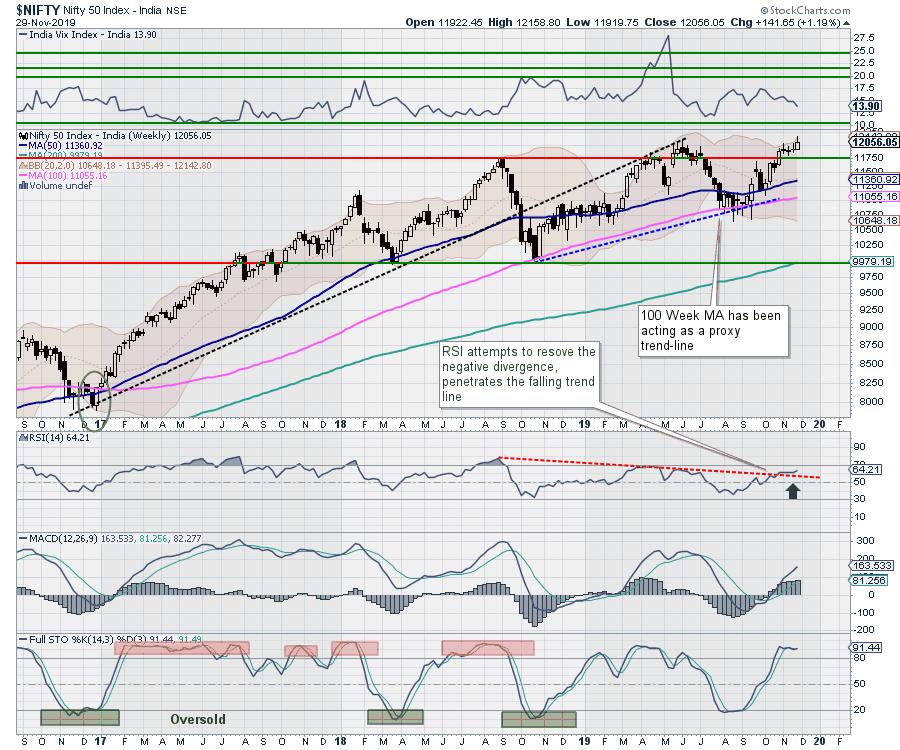
The coming week is set to be crucial for the markets, as it will decide its trajectory for the near-term. The NIFTY has not broken out of the double-top resistance on the short-term charts, which stands at 12103. However, on the weekly charts, the NIFTY looks to be preparing the ground for a breakout, as the RSI has broken out after penetrating a falling trend line joining its lower tops. In the process, the RSI has also resolved a bearish divergence. On the other side, the markets will have to digest weak GDP numbers, which were more or less discounted during the day.
The coming week also expected to see some volatility rising as the NIFTY attempts to break above its crucial resistance levels and digest the weak GDP numbers in the process. The levels of 12160 and 12385 will act as immediate resistance points while supports will come in at the 11900 and 11800 levels. The trading zone is expected to stay wider than usual for the markets.
The Relative Strength Index (RSI) on the weekly chart is 64.21; it has marked a fresh 14-period high, which is bullish. The RSI also appears to be resolving the continued bearish divergence in favor of potential upside as it has penetrated above the falling trend line that joined its lower tops. The weekly MACD is bullish and trades above its signal line.
The pattern analysis of the weekly charts shows that the primary uptrend, which continued for over three years, was interrupted at the end of 2018. The NIFTY has presently been in a secondary trend for over a year. The index appears to be attempting to break out of this trend. It would be important to see if the present pattern acts as a continuation pattern over the coming weeks.
We might see some initial reactions to the weak GDP data, meaning we could see some increase in the volatility over the coming days. However, this being said, there is a higher chance that the NIFTY attempts once again to move past the crucial 12103 level and close above it.
All in all, the ancillary readings point towards likely up move over the coming days. That said, as of now, NIFTY is yet to experience a clean breakout and, by the time this happens, it would be recommended to keep chasing the momentum carefully. Shorts should be avoided and, until the attempt to break out fails, all downside moves should be used to make modest purchases. A cautiously positive approach is advised for the time being.
Sector Analysis for the Coming Week
In our look at Relative Rotation Graphs, we compared various sectors against CNX500 (NIFTY 500 Index), which represents over 95% of the free float market cap of all the stocks listed.
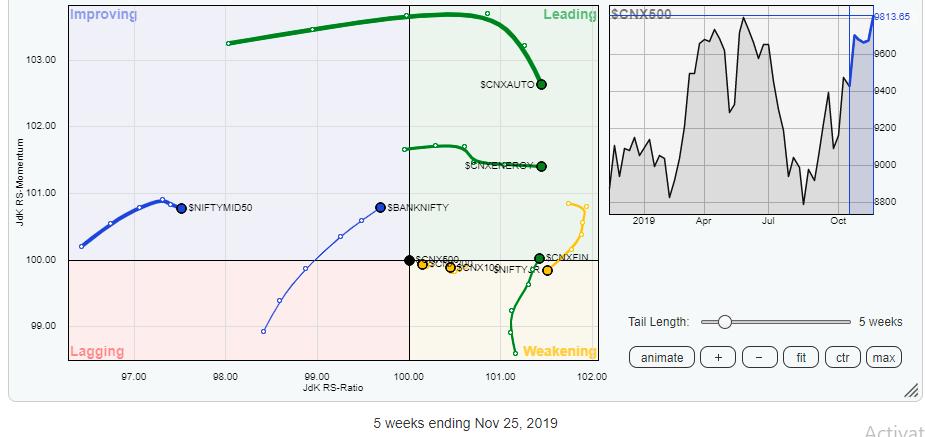
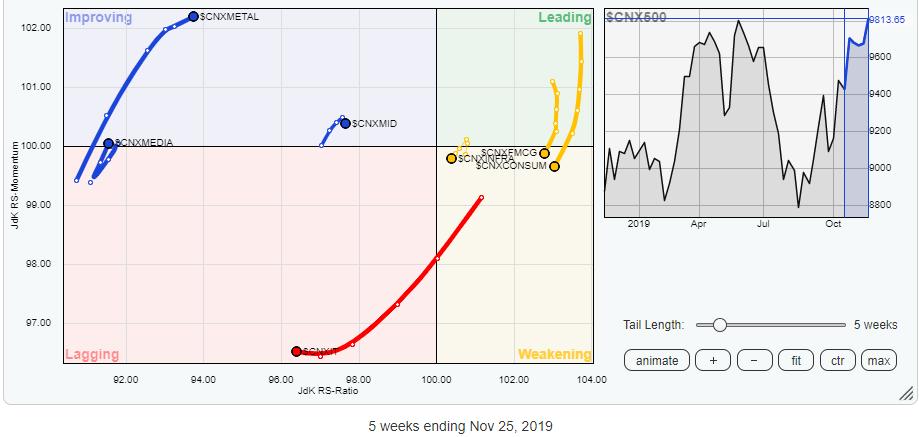
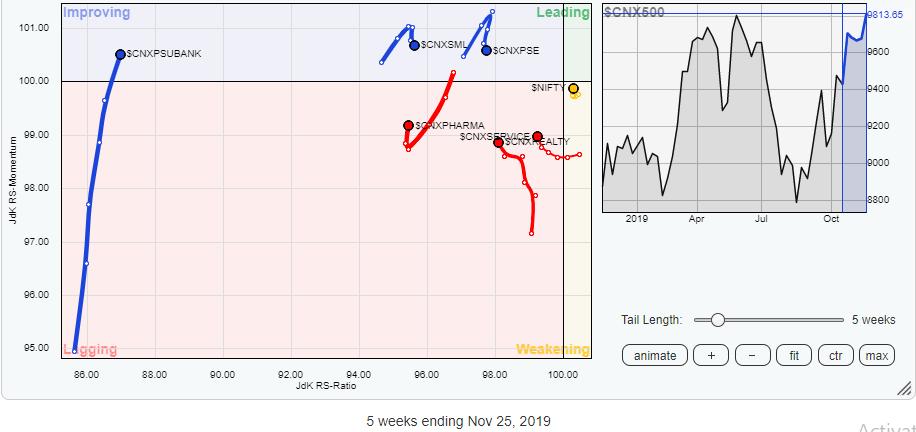
Our review of Relative Rotation Graphs (RRG) shows NIFTY Private Banks, PSU Banks, BankNifty and the Financial Services Index experiencing strong rotation towards the leading quadrant. The Energy Index also remains in the leading quadrant; collectively, these groups are likely to relatively outperform the markets over the short term. The commodities space also shows some strong momentum and may see stock-specific performance over the coming weeks.
On the other side, the FMCG and Consumption have topped out and are expected to lose momentum going ahead as they have moved into the weakening quadrant. The IT group, too, is expected to continue to underperform the broader markets. The Infrastructure space also may underperform as it is witnessing the rotation towards the lagging quadrant.
Important Note: RRG™ charts show you the relative strength and momentum for a group of stocks. In the above chart, they show relative performance against NIFTY500 Index (Broader Markets) and should not be used directly as buy or sell signals.
Milan Vaishnav, CMT, MSTA
Consulting Technical Analyst,


