In contrast to the one that came before, this past week gave back all its gains while ending near the low point of the trading range. The markets were sitting on the verge of a breakout, but that did not amount to anything as the markets refused to break above its crucial resistance zone. The week stayed relatively range-bound, with the NIFTY oscillating in a 250-point range. The shorter timeframe charts had already shown some weakness and loss of momentum, while the longer-term charts painted a similar picture. The NIFTY finally ended with a net loss of 134.55 points (-1.12%) on a weekly note.
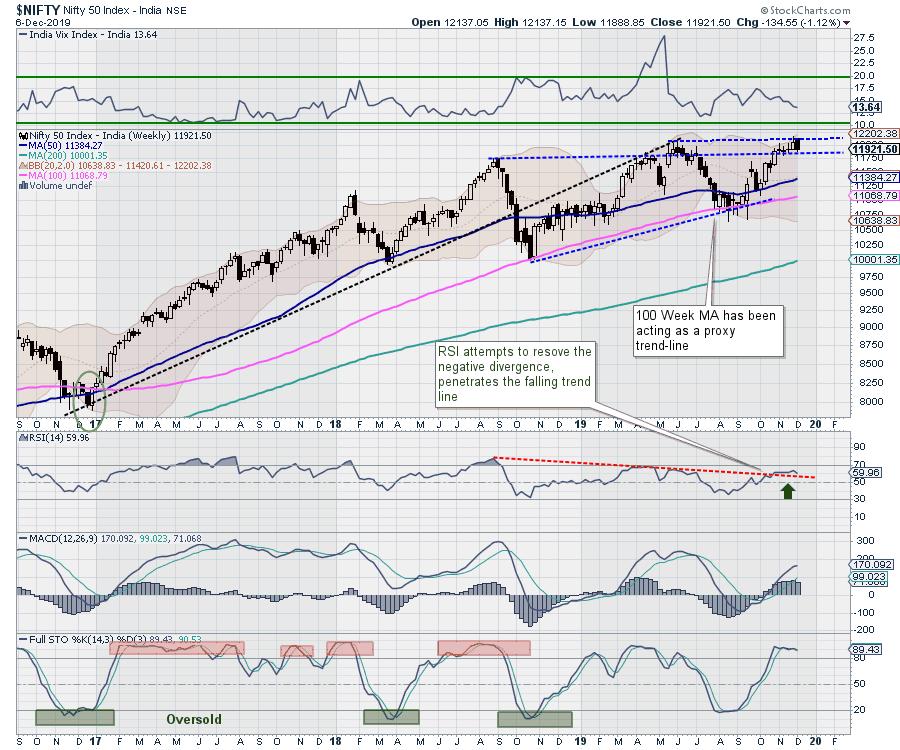
The markets have poised themselves at a crucial juncture once again. The India VIX has cooled off further by 1.85% to 13.64. The Volatility Index presently trades near its multi-month low levels, reflecting the complacency of the market players. When complacency is seen as the markets are at their highs, that's not good for the near-term. Apart from this, however, the NIFTY has kept its hopes for a possible breakout alive as the RSI has attempted to resolve its bearish divergence against the price. The coming week is expected to stay crucially important and may decide the trajectory of the markets for the coming weeks.
As we expect a tepid start to the week, the NIFTY is likely to face resistance at 12150 and 12275. The supports will come in at 11900 and 11780. In the event of any down move, the range may get wider than usual and volatility also may increase.
The Relative Strength Index (RSI) on the daily chart is 59.96; it remains neutral and does not show any divergence against the price. The RSI has attempted to penetrate the falling trend line that joins RSI's lower tops, but that is seen taking a breather. The weekly MACD is still in buy mode and trading above its signal line. No important formations were seen on the candles.
The pattern analysis of the weekly chart shows that, after the secular 36-month long uptrend got interrupted at the end of 2018, the Indian markets have been trading more in a broadly sideways range. We can interpret this as a small secondary trend. Despite making incremental highs, the NIFTY has not been able to achieve a breakout.
All in all, though markets still have few chances of breaking out, it is likely to happen only if the NIFTY moves past and closes above 12150 convincingly. Until this happens, we are likely to see some range-bound consolidation. Corrective pressures from higher levels cannot be ruled out. The attempt to breakout failed to confirm itself; that loss of momentum is evident on the charts. We recommend avoiding aggressive positions and approaching the markets on a highly selective note until a directional bias is established.
Sector Analysis for the Coming Week
In our look at Relative Rotation Graphs, we compared various sectors against CNX500 (NIFTY 500 Index), which represents over 95% of the free float market cap of all the stocks listed.
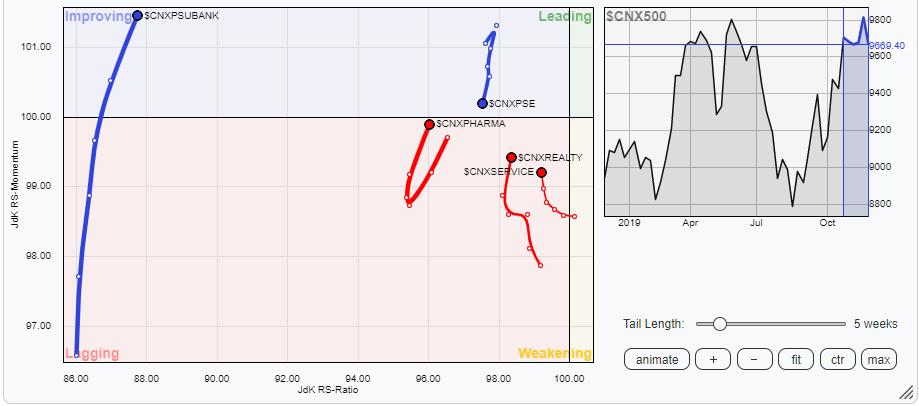
 5-week RRG ending 06 December
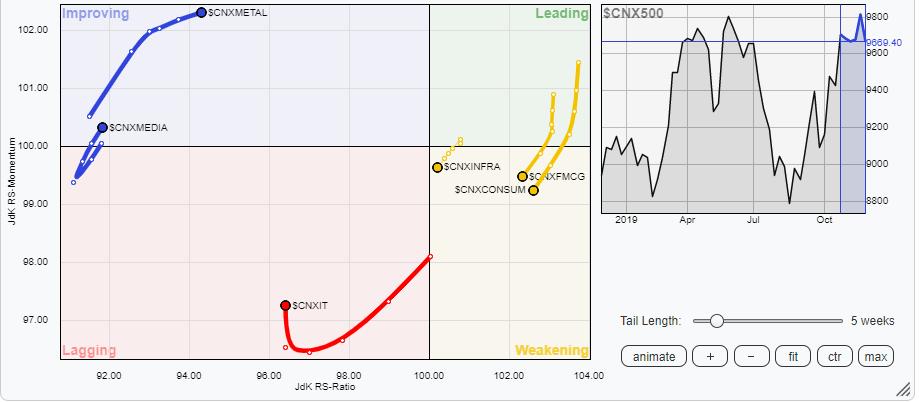
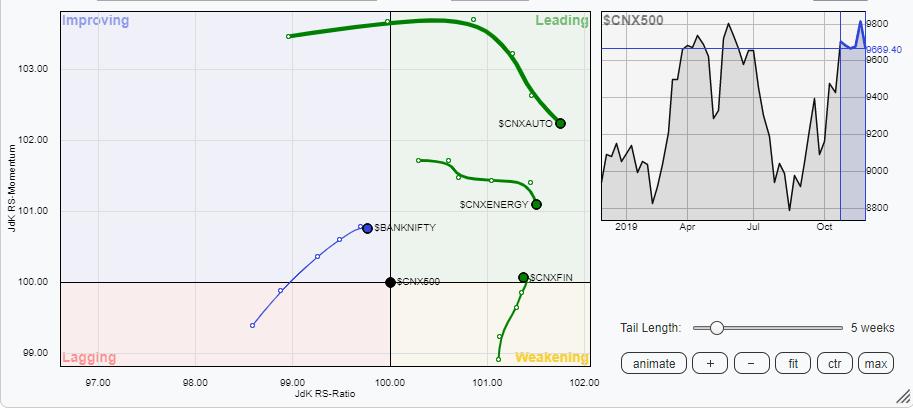
The review of Relative Rotation Graphs (RRG) shows some sudden loss of momentum across a few sectors. The NIFTY Auto and Energy packs are seen continuing to lose momentum while remaining in the leading quadrant. The Financial Services group, which had shown a steady rotation in the previous week, is also seen retreating suddenly. Along with this, loss of momentum is also seen in the FMCG, Consumption, Commodities, Infrastructure and PSE indexes. These groups, collectively, may not contribute much to the outperformance when benchmarked against the broader NIFTY 500 index.
The IT pack is seen arresting its decline. It remains in the lagging quadrant, but it appears to have stalled its decline. The Realty and Services sector indexes are also seen consolidating their performance and improving their relative momentum against the broader markets.
Some resilient performance can be expected from the PSU Banks, Metal and Media packs as they are steadily advancing while remaining in the improving quadrant. The NIFTY Pharma index, too, is seen rotating strongly towards the improving quadrant.
Important Note: RRG™ charts show the relative strength and momentum for a group of stocks. In the above chart, they show relative performance against NIFTY500 Index (Broader Markets) and should not be used directly as buy or sell signals.
Milan Vaishnav, CMT, MSTA
Consulting Technical Analyst,


