The risk-on global setup towards the end of the week saved the Indian markets from ending on a net negative note. Following a weak initial performance, the Indian markets picked up in the second half of the week. The NIFTY pulled itself back after testing the lower end of the consolidation range that it has formed, moving towards the upper end of that zone. The overall volatility declined over the past couple of days and the headline index NIFTY closed the week with a net gain of 162.20 points (+1.39%).
The market has again come to a crucial point where it will still attempt a breakout. The shorter-timeframe charts may support some incremental moves on the upside, but the longer-timeframe charts show bearish divergence continuing to persist on the lead indicators. Apart from this, the markets will react to the GST Council meeting, where the upward revision of GST is certain. Though much is supposed to have been discounted by the markets, volatile reactions cannot be ruled out.
The markets have ended again at a Double Top resistance level of 12103. The zone of 12100-12160 has now become crucial for the markets once again. The coming week will see the NIFTY finding resistance at 12160 and 12230 on the upside. The supports will come in at 11800 and 11710. In the event of any retracement, the trading range is expected to remain broader than usual.
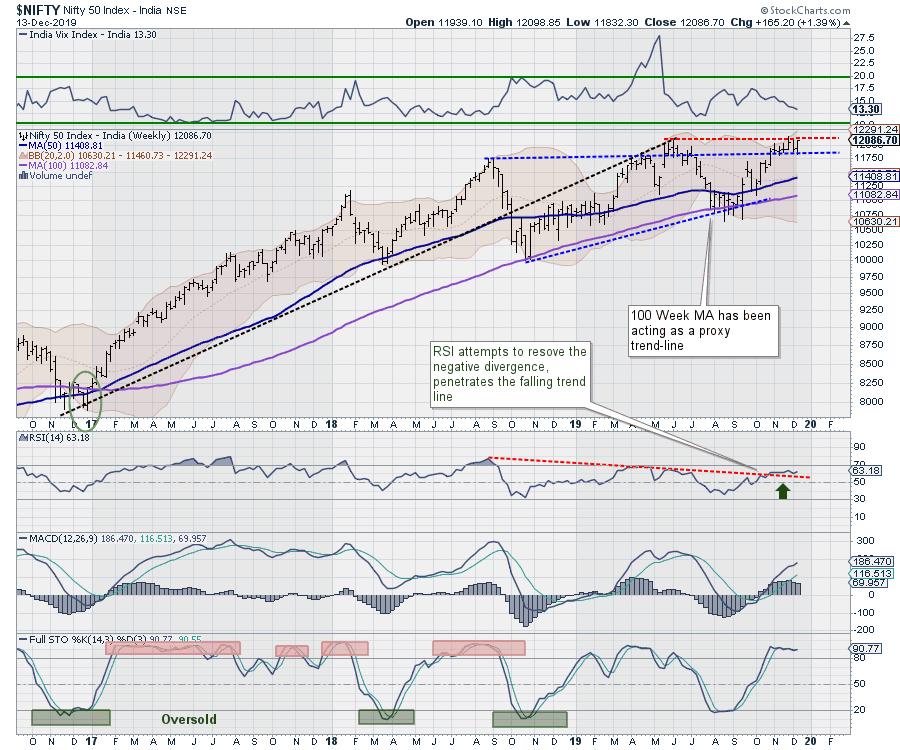
The Relative Strength Index (RSI) on the daily chart is 63.18. The RSI has not marked a fresh 14-period high as the NIFTY has, which presents a bearish divergence against the price. The MACD remains bullish and continues to trade above its signal line. No significant patterns were formed on the Candles.
The pattern analysis of the weekly charts shows that the NIFTY is again testing the upper end of the trading zone that formed over the past couple of weeks. A clean breakout has continued to elude the markets, despite the NIFTY marking incremental highs in the recent past.
The India Volatility Index (INDIAVIX) has further cooled off in the previous week by 2.49% to 13.30. It is trading near one of its lowest levels observed over the past couple of months. Prolonged periods of low volatility in the markets reflect complacency among market participants; this is the time when we need higher vigilance at higher levels. We recommend not taking the occurrence of a breakout for granted. It would be advisable if we wait for the breakout to actually happen and being subsequently confirmed. Until that happens, it would be prudent to keep protecting profits at higher levels while maintaining a cautiously positive bias towards the markets.
Sector Analysis for the Coming Week
In our look at Relative Rotation Graphs, we compared various sectors against CNX500 (NIFTY 500 Index), which represents over 95% of the free float market cap of all the stocks listed.
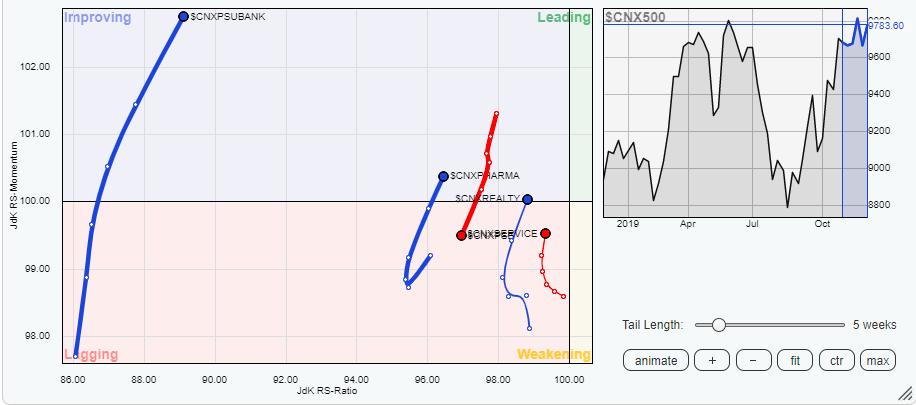
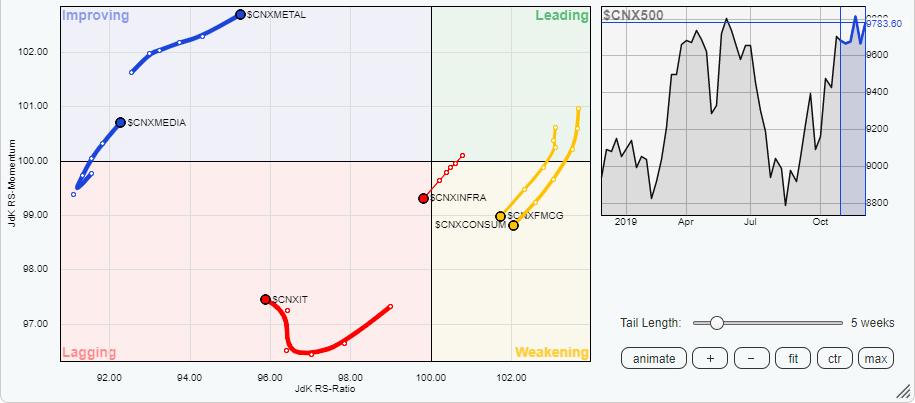
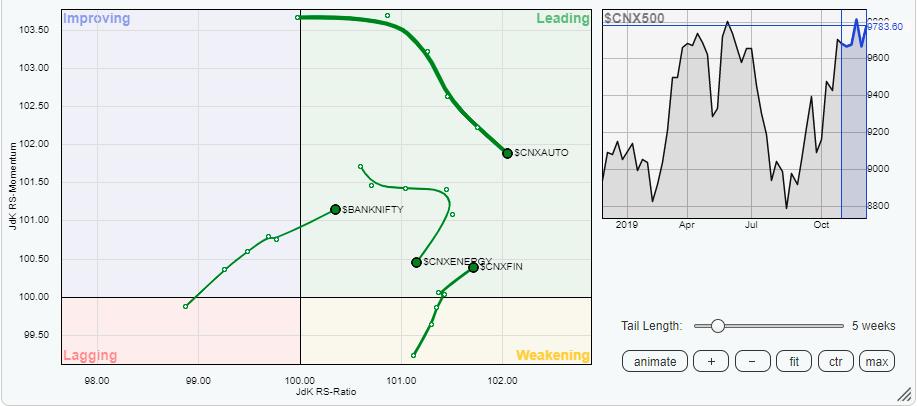
Our review of Relative Rotation Graphs (RRG) shows some strong rotations in the PSU Bank, Metal, BankNIFTY and Financial Services spaces. The PSU Bank and the Metal index have advanced further while staying in the improving quadrant. The BankNIFTY and the Financial services indexes have crawled into the leading quadrant. These groups are likely to relatively outperform the broader markets. The Auto and the Energy indexes are also in the leading quadrant; they seem to be slowing down a bit, but may still continue with their relative outperformance.
The IT group continues to remain a dominant outperformer, lying far away in the lagging quadrant. Besides IT, the Infrastructure and NIFTY PSE indexes also remain in the lagging quadrant.
The FMCG and Consumption groups, along with commodities, are also seen heading southward. These groups, along with IT, Infrastructure and PSE, may potentially underperform the broader markets on a relative basis.
Important Note: RRG™ charts show the relative strength and momentum for a group of stocks. In the above chart, they show relative performance against NIFTY500 Index (Broader Markets) and should not be used directly as buy or sell signals.
Milan Vaishnav, CMT, MSTA
Consulting Technical Analyst,


