The week remained largely uneventful for the markets, as they traded in a narrow range and consolidated over the past five days. The trading range also remained very narrow compared to the earlier weeks. The NIFTY witnessed a movement in the band of just 235-odd point while avoiding taking any directional call with a conviction. The buoyancy was questioned many times at higher levels, but, at the same time, the NIFTY also showed resilience when there were weak moments on the global landscape. The NIFTY did make a higher top and a higher bottom than its previous bar, but ended on a quite flat note. The headline index ended with a net gain of 40.50 points (+0.35%) on a weekly basis.
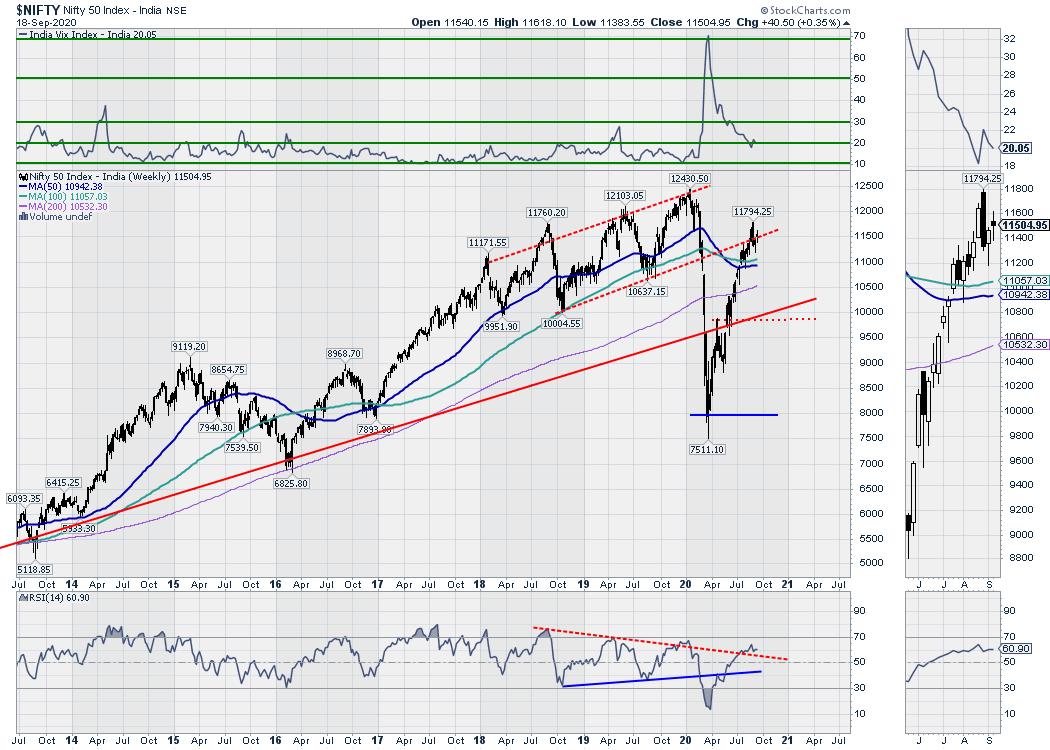
The week did not see any major directional moves on either side. This ensured that the NIFTY remained above its crucial support zone of 50-Week MA and 100-Week MA. These MA are in close vicinity to each other and are currently placed at 10942 and 11057, respectively. In any adverse trade setups, this zone of 10940-11050 represents a strong support area for the NIFTY. The upsides in the coming week will continue to remain capped on the higher side, as the NIFTY is lacking the momentum it needs to surge higher, and it also remains slightly precarious from the pattern analysis point of view. The INDIAVIX came off by 3.22% to 2.05 on a weekly basis.
The coming week is likely to see a quiet start to the trade. The levels of 11595 and 11680 will act as resistance points. The supports will come in at the 11310 and 11235 levels. The upsides to the market may stay capped; however, any corrective pressures may make the trading range a bit wider than usual.
The weekly RSI is 60.90; it remains neutral and does not show any divergence against the price. The weekly MACD is bullish and trades above its signal line. The slope of the histogram is slowly declining, which shows a decelerating momentum over the past couple of weeks. A spinning top emerged on the candles. This essentially happens due to indecisive behavior of the market participants and may also act as a potential reversal point. That would need a confirmation on the next bar, though.
The pattern analysis reveals a cautious picture. A large bearish engulfing candle had emerged two weeks back. The high of that candle resisted exactly to the falling trend line that joins the subsequent lower tops. This week, the formation of a spinning top has a potential to temporarily disrupt the moves. The Index trades above all key moving averages and the zone of 10940-11050 represents an important pattern support zone for the Index.
Overall, the coming week warrants a cautious approach towards chasing any kind of momentum on the upside. The upsides will continue to stay capped, while the downward pressures may either stay volatile or a bit extended. In any case, it would be prudent to not only stay stock-specific, but also favoring defensives as compared to high-beta stocks, unless that position is highly stock-specific. We recommend a highly cautious view for the coming week.
Sector Analysis for the Coming Week
In our look at Relative Rotation Graphs®, we compared various sectors against CNX500 (NIFTY 500 Index), which represents over 95% of the free float market cap of all the stocks listed.
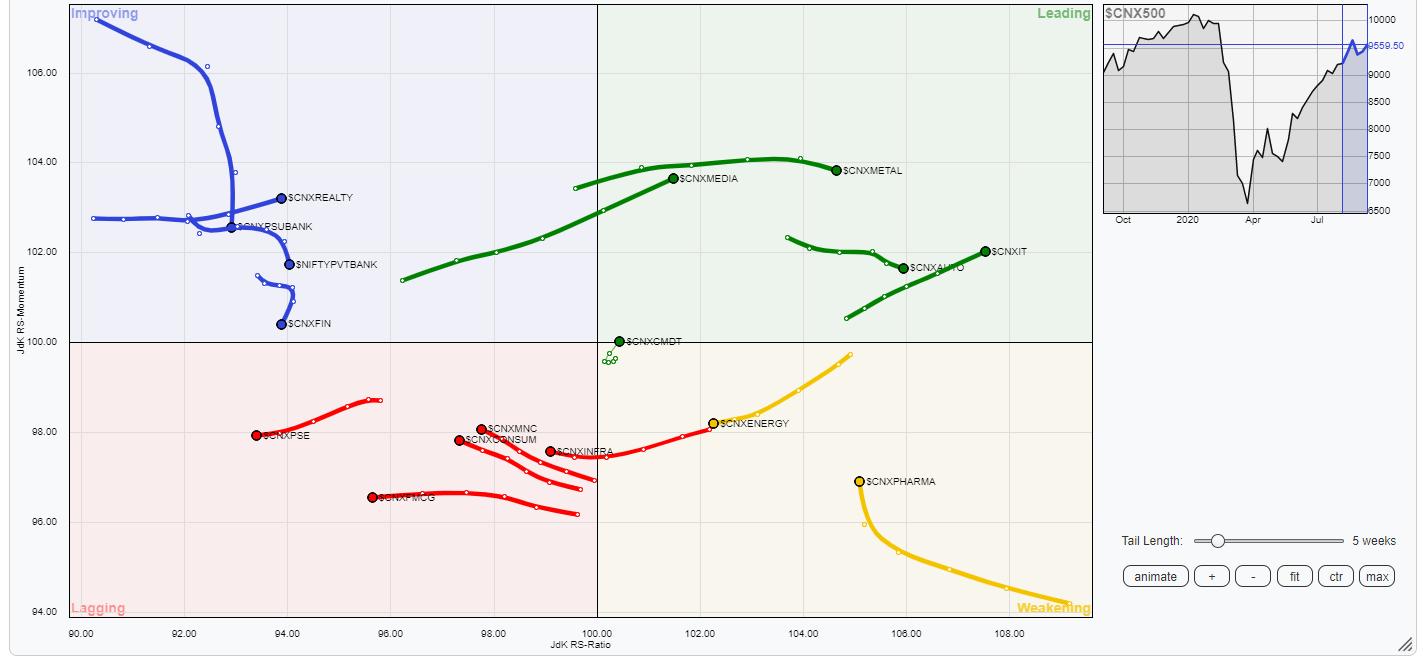
The review of Relative Rotation Graphs (RRG) does not show any major change on the sectoral landscape this week.
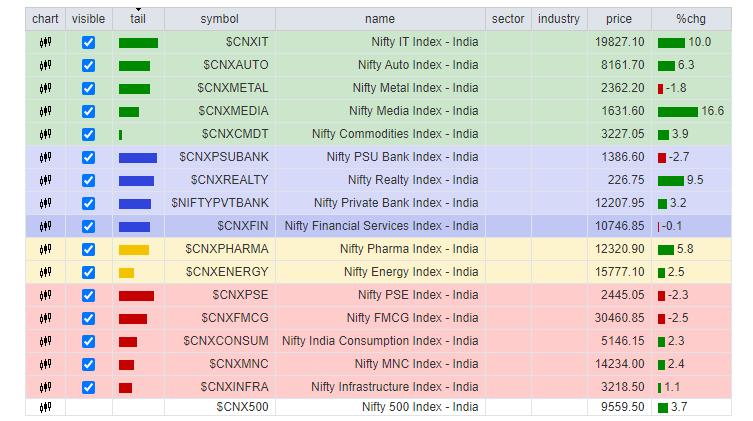
The broader markets will continue to outperform as the NIFTYCAP100 stays firm in the leading quadrant. The NIFTY IT, AUTO, Metal and Media groups are also in the leading quadrant. NIFTY Commodities has made a U-turn back inside the leading quadrant again. All these groups are set to relatively outperform the broader NIFTY500 Index.
NIFTY Energy is in the weakening quadrant. NIFTY Pharma, too, is the weakening quadrant, but it has arrested its loss of momentum and is seen moving higher within the quadrant. This may cause the Pharma index to put up an extremely resilient show.
The FMCG and Consumption packs continue to languish in the lagging quadrant; the Consumption Index shows some sigh of improvement on the relative momentum front. NIFTY PSE group is in the lagging quadrant and may relatively underperform the broader markets.
The Realty stays firm in the improving quadrant. The Financial Services, BankNIFTY and PSUBank Indexes are also in the improving quadrant, but appear to be rotating negatively while sharply paring their relative momentum. This may cause their relative underperformance to persist for some more time.
Important Note: RRG™ charts show the relative strength and momentum for a group of stocks. In the above chart, they show relative performance against NIFTY500 Index (Broader Markets) and should not be used directly as buy or sell signals.
Milan Vaishnav, CMT, MSTA
Consulting Technical Analyst


