The Indian equities ended the week with modest gains, as they struggled to keep afloat when the global markets showed sharp corrective moves that led to the revision of means. In a trading range that stayed narrower compared to the week prior, the headline index ended with gains, while the banking and financial stocks continued stay subdued. The corrective moves affected sectors across the board and the broader markets were not spared either, which also closed the week on a negative note. The NIFTY saw itself oscillating in a just-over 300-point range, before closing the week with a net gain of 130.60 points (+1.15%).
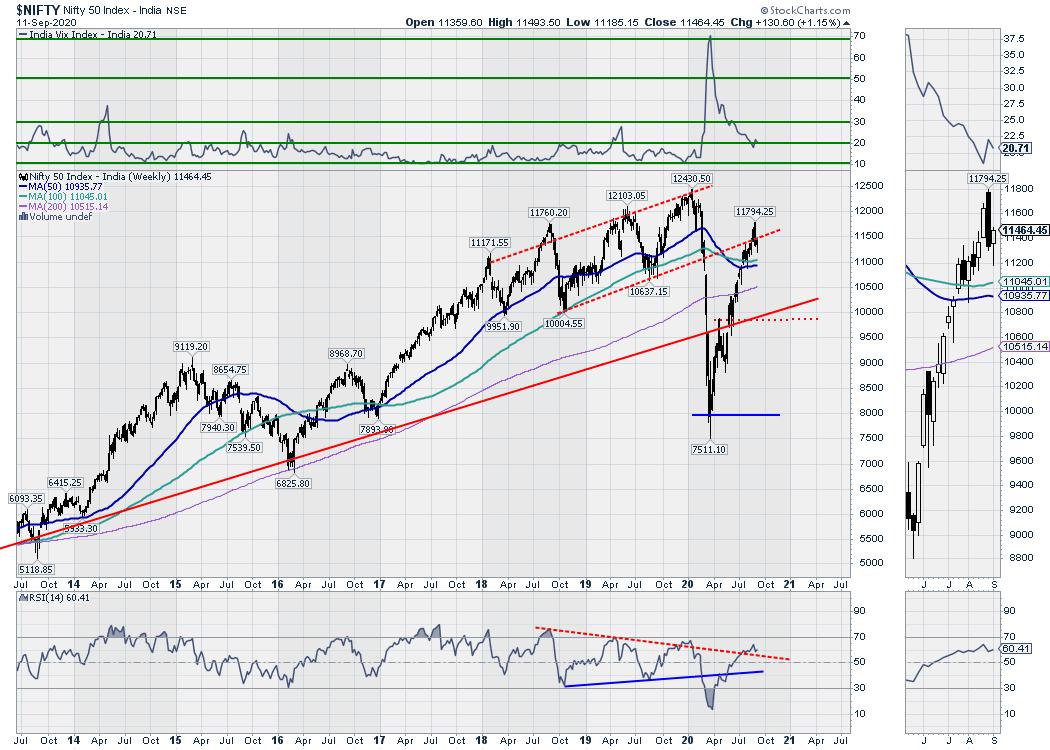
What we saw over the past two weeks was a sharp mean-reversion of the markets, which, in general, were overextended and, if they move towards their nearest MA as a support, which is a usual phenomenon. Only when they drop below the 50-Period MA does it becomes a matter of concern. In the week that has gone by, the NIFTY has seen some important pattern developments, which cause a serious concern for the immediate near-term. The volatility too declined as the INDIAVIX came off by another 6.50% to 20.71; one of the lowest values of recent times. In the event of volatility increasing, the NIFTY's behavior vis-à-vis the 50- and 100-Week MAs would be crucial, as they form a major pattern support in the near term.
The coming week is likely to see the levels of 11585 and 11650 acting as resistance points. The supports come much further below, at the 11250 and 11000 levels. In case of some uptick in volatility, we may be staring at a wider-than-usual trading range.
The weekly RSI stands at 60.41; it remains neutral and does not show any divergence against the price. The weekly MACD is still bullish; it is still above the signal line. However, the declining slope of the histogram points towards decelerating momentum on the charts. Following a large bearish engulfing patten formed on the candle in the previous week, there is a formation of a hammer. However, the occurrence of the hammer during an uptrend is insignificant, as it has implications of more like a hanging man candle in the present structures.
The pattern analysis paints a concerning picture. On the daily chart, we have seen NIFTY falling out of a large rising wedge pattern. Although the wedge is large and looks more like a upward-rising channel, it is sharply narrowing, making itself a wedge. In a similar way, also on the weekly charts, such a rising wedge is clearly seen, and the NIFTY has fallen out of this pattern. The fractal nature of these patterns is a matter of concern. When this pattern ended, NIFTY fell out of it exactly at a pattern resistance point of the lower trend line that the NIFTY had broken. In the process, the 11800 point as become an intermediate top for the markets in the near-term.
All in all, even if some momentum is seen in the discretionary and riskier space, it would be prudent to stay focused on the defensive stocks and sectors. IT too may start performing if there is even a slight pullback in the Dollar Index, which will cause the Indian Rupee to depreciate. We recommend sticking to a defensive approach throughout the coming week.
Sector Analysis for the Coming Week
In our look at Relative Rotation Graphs®, we compared various sectors against CNX500 (NIFTY 500 Index), which represents over 95% of the free float market cap of all the stocks listed.
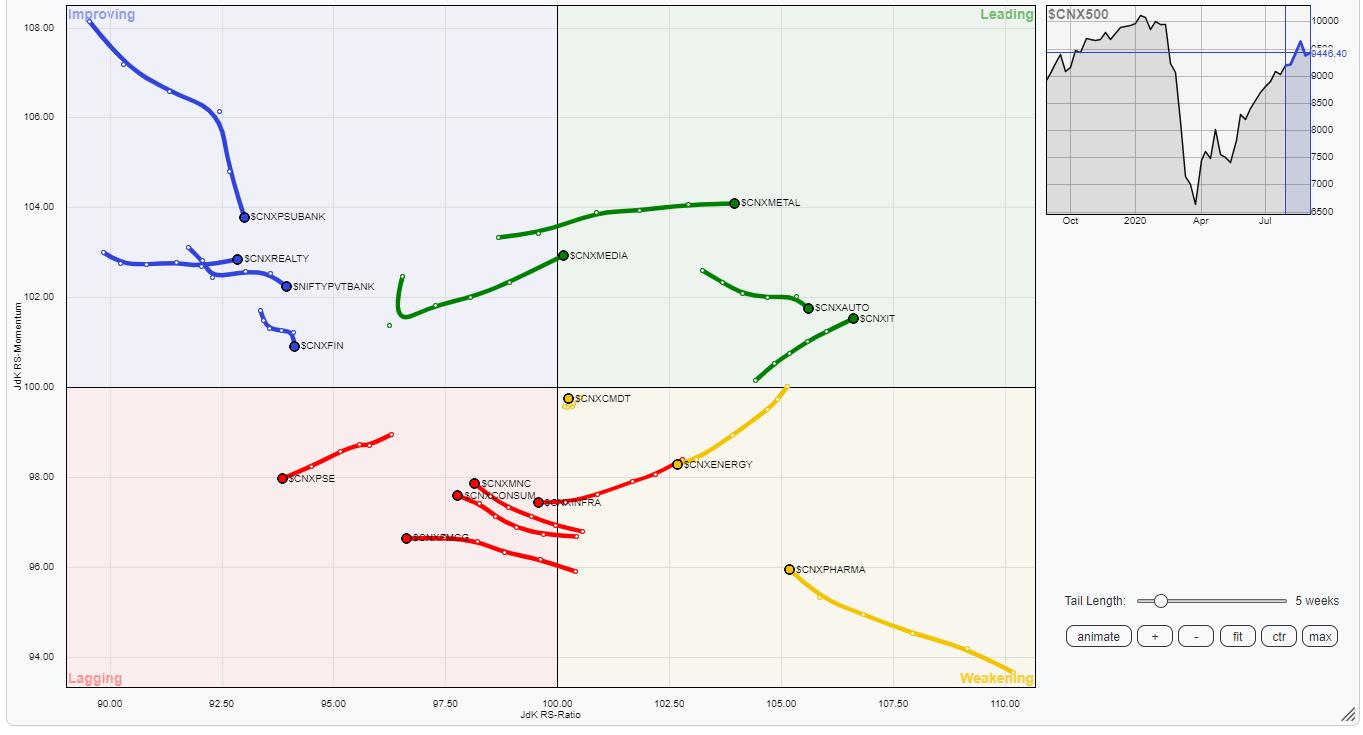
The review of Relative Rotation Graphs (RRG) shows that the PSUBanks have continued to lose momentum, just like it did in the previous week.
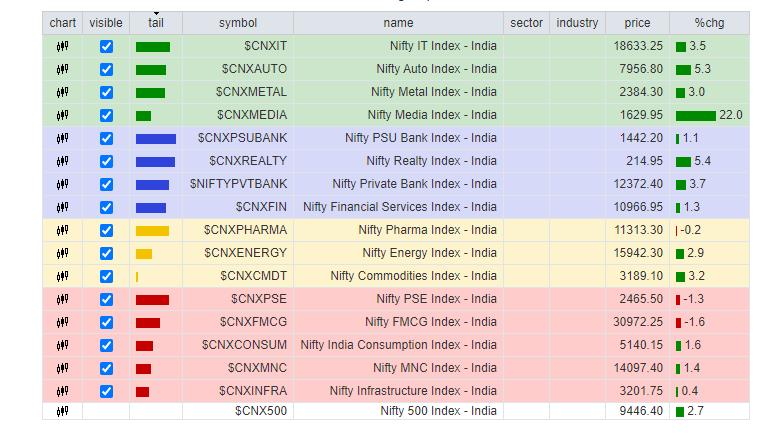
The NIFTY IT, Metal and Auto groups are firmly placed in the leading quadrant. To give them a company, the NIFTY Media Index has also moved inside the leading quadrant. These groups will continue to outperform the broader NIFTY500 Index relatively.
The financial space has lost some more momentum during the previous week. The PSU Banks and the BankNIFTY have shown a decline in their relative momentum as the interest case outcome continued to weigh heavy on this space. They are currently placed in the improving quadrant. The NIFTY Financial Services and Realty Indices are also placed in the improving quadrant.
The Pharma index is placed in the weakening quadrant, but it appears to be improving on its relative momentum. The Infrastructure Index has moved inside the lagging quadrant. The FMCG, Consumption and PSE Indexes also appear to be languishing inside the lagging quadrant. They are set to underperform the broader NIFTY on a relative basis.
Important Note: RRG™ charts show the relative strength and momentum for a group of stocks. In the above chart, they show relative performance against NIFTY500 Index (Broader Markets) and should not be used directly as buy or sell signals.
Milan Vaishnav, CMT, MSTA
Consulting Technical Analyst,


