In the previous week's note, it was mentioned that the markets have shown first signs of fatigue as they marked the high point of 14653. This was the point where profit-taking bouts emerged. Over the week that went by, the markets did make some incremental highs; however, they failed to move past and sustain above the earlier week's high. This made the level of 14653 a potential intermediate top for the markets. Also, on the expected lines, the trading range stayed much wider, while the markets witnessed collective moves. Meanwhile, the NIFTY oscillated in the range of 531 points before finally ending with a negligible loss of 61.80 points (-0.43%) on a weekly basis.
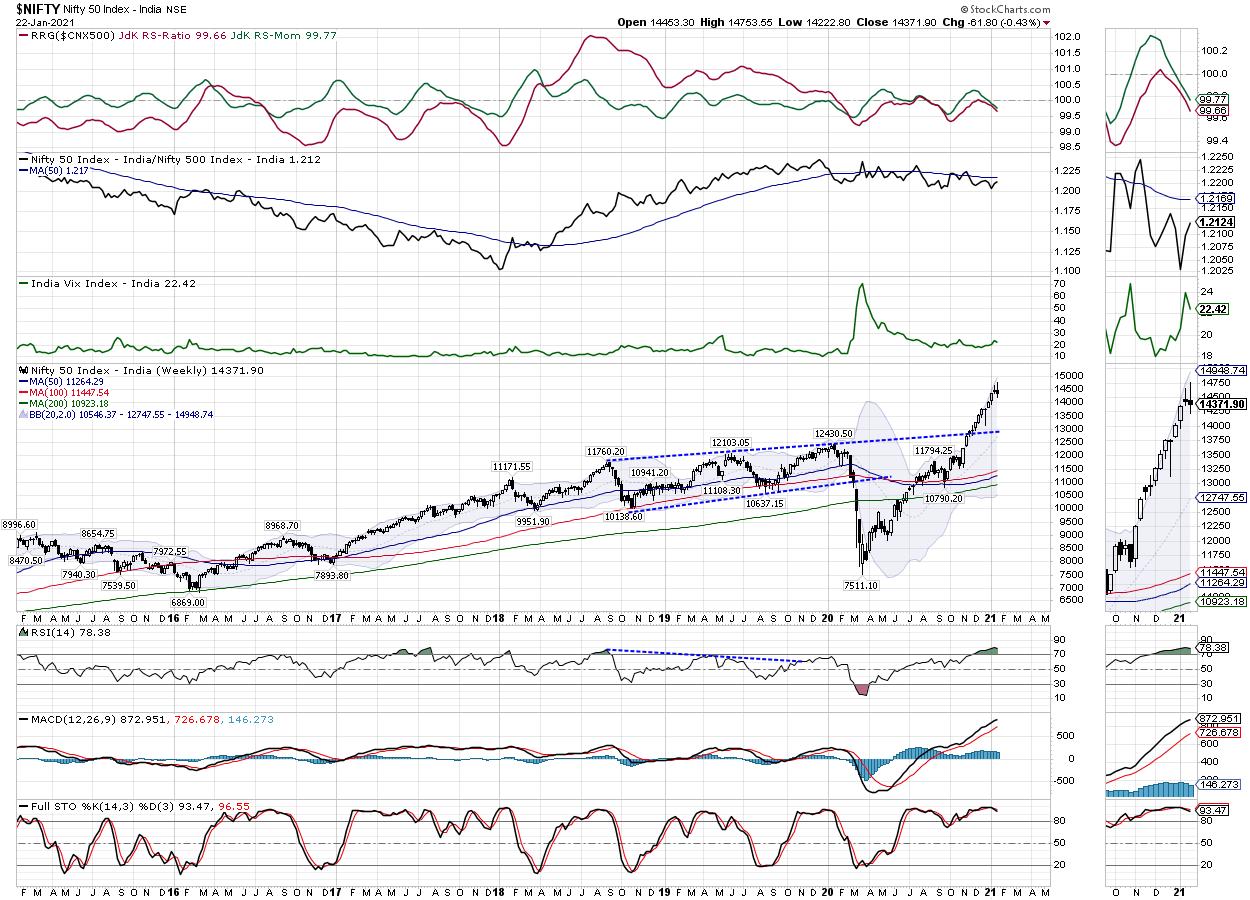
The coming week is a truncated one, with January 26th off on account of Republic Day. Regardless of any underlying buoyancy or liquidity-driven up moves, the markets have sharply deviated from the mean. This is evident from that the fact that even the 20-week MA is presently at 12747; somewhat 1624-odd points from the current levels. Because of this, the Bollinger bands have become much wider than usual, indicating a high probability of very limited upsides from the current levels. There is a high chance that we see the NIFTY continuing with its corrective activity within a broad range and on lower volumes. As we approach the Union Budget, the volatility is likely to increase over the coming days.
Over the previous week, though, volatility subsided a bit, with INDIAVIX coming off by 6.61% to 22.42 on a weekly basis. The coming week is likely to see the levels of 14450 and 14530 as potential resistance points. The supports will come in at 14250 and 14000 levels. The trading range is expected to remain wider over the coming week as well.
The weekly RSI is 78.38; it remains neutral and does not show any divergence against the price. However, RSI is in overbought territory. The daily MACD is bullish as it remains above the signal line. A spinning top occurred for the second consecutive week. This candle has been formed out of a small real body; it is also a candle with a long upper shadow, which shows potential stalling of the current up move.
The pattern analysis shows that the following breakout from the 13000-mark, as the NIFTY penetrated and broke above the rising trend line resistance, has probably marked a potential top at 14653. For the next immediate intermediate-term, the zone of 14650-14750 will be a strong resistance are for the NIFTY.
All and all, regardless of the approach of the Union Budget or liquidity fueling the rally, if any, it is time to avoid chasing the high beta stocks and those stocks that have run up too hard over the previous weeks. All up moves from this point, if at all they occur, should be used for book profits and taking some money off the table.
We strongly reiterate that even if some short-term momentum is seen over the coming days in speculation built up ahead of the Union Budget, it would be prudent to stay put with traditionally defensive stocks like IT, Pharma, FMCG and Consumption. Any new purchases from this point should be kept extremely stock-specific and exposures should be kept at modest levels.
Sector Analysis for the Coming Week
In our look at Relative Rotation Graphs®, we compared various sectors against CNX500 (NIFTY 500 Index), which represents over 95% of the free float market cap of all the stocks listed.
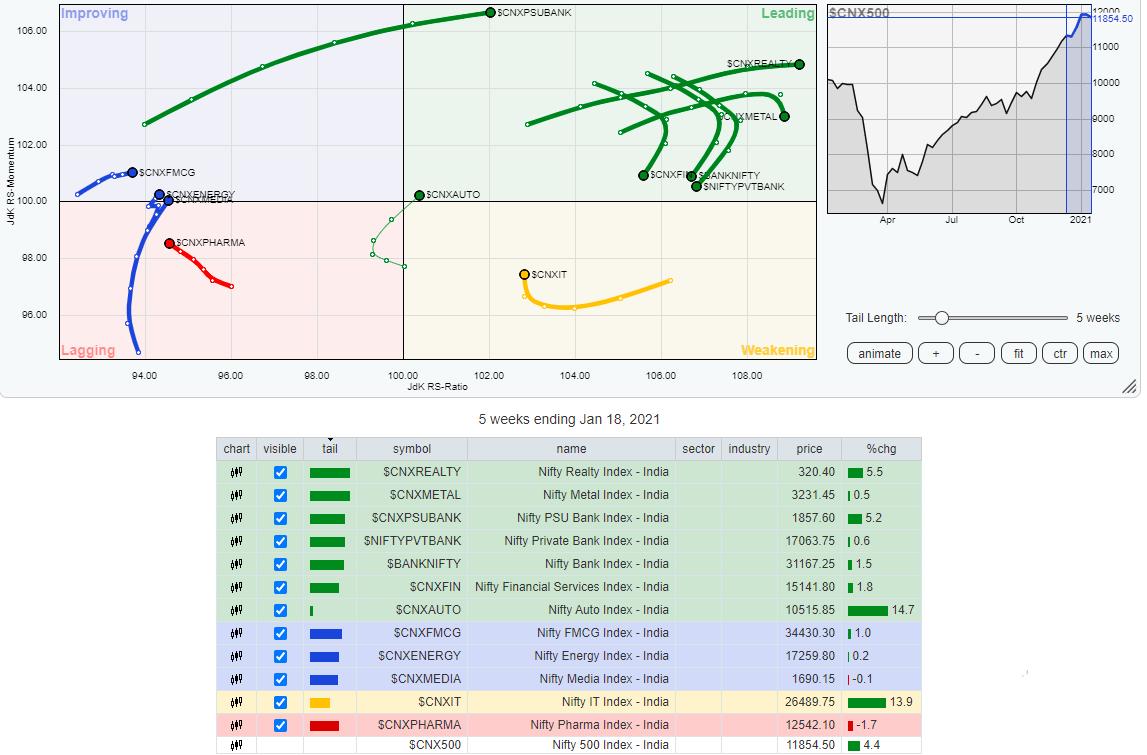
The review of Relative Rotation Graphs (RRG) shows the NIFTY Financial Services, Commodities, Nifty Bank, Services Sector and Metal Indexes sharply paring their relative momentum, despite being in the leading quadrant. There is a possibility that these groups may gradually stop outperforming the broader markets.
The NIFTY PSU Bank and NIFTY Realty indexes are still firmly placed in the leading quadrant, accompanied by NIFTY MidCap100 Index. These groups are likely to relatively outperform the broader NIFTY500 index, along with NIFTY Auto, which has just entered the leading quadrant.
The IT Index is the only index in the weakening quadrant; that too is seen sharply improving on its relative momentum against the broader markets.
NIFTY Pharma continues to falter inside the lagging quadrant, though it appears to be in the process of improving its relative momentum. NIFTY Media has just entered inside the improving quadrant, pointing to a likely end to its relative underperformance.
The NIFTY PSE, Infrastructure, FMCG, Infrastructure and Energy groups are also placed inside the improving quadrant. These groups may put up a resilient show going ahead from here.
Important Note: RRG™ charts show the relative strength and momentum for a group of stocks. In the above chart, they show relative performance against NIFTY500 Index (Broader Markets) and should not be used directly as buy or sell signals.
Milan Vaishnav, CMT, MSTA
Consulting Technical Analyst,


