Following a strong earlier week, the previous week saw some extension of the up move as the NIFTY ended on a positive note. Most of the past five sessions saw the index trading in a capped range with limited upsides. Unlike the earlier week, which had a very wide-ranging move, the previous days saw the markets oscillating in a very limited range. The NIFTY moved in a narrow 279-odd points range before closing the week with gains. The volatility also tapered down over the past five sessions. The headline index ended with net gains of 239.05 points (+1.60%) on a weekly basis.
On the global landscape, there are a few important technical developments that have taken place. The US Dollar Index (DXY) has rolled over inside the improving quadrant, indicating a likely end of its relative underperformance over other asset classes. The US Treasury Bonds are also showing consistent improvement in their relative momentum against other asset classes. On the domestic front, the NIFTY continues to stay highly overstretched on the charts and has run up much ahead of the curve, showing significant deviation from its mean. All this means that, even if there is no major decline in the equities, there is a very high chance that the equity markets slip into some corrective consolidation.
The strengthening of the US Dollar Index is not a great positive for the emerging markets. Over the coming days, the levels of 15250 and 15365 will act as immediate resistance points. The supports come in much lower at the 15000 and 14890 levels. Any corrective move will make the trading range wider than usual.
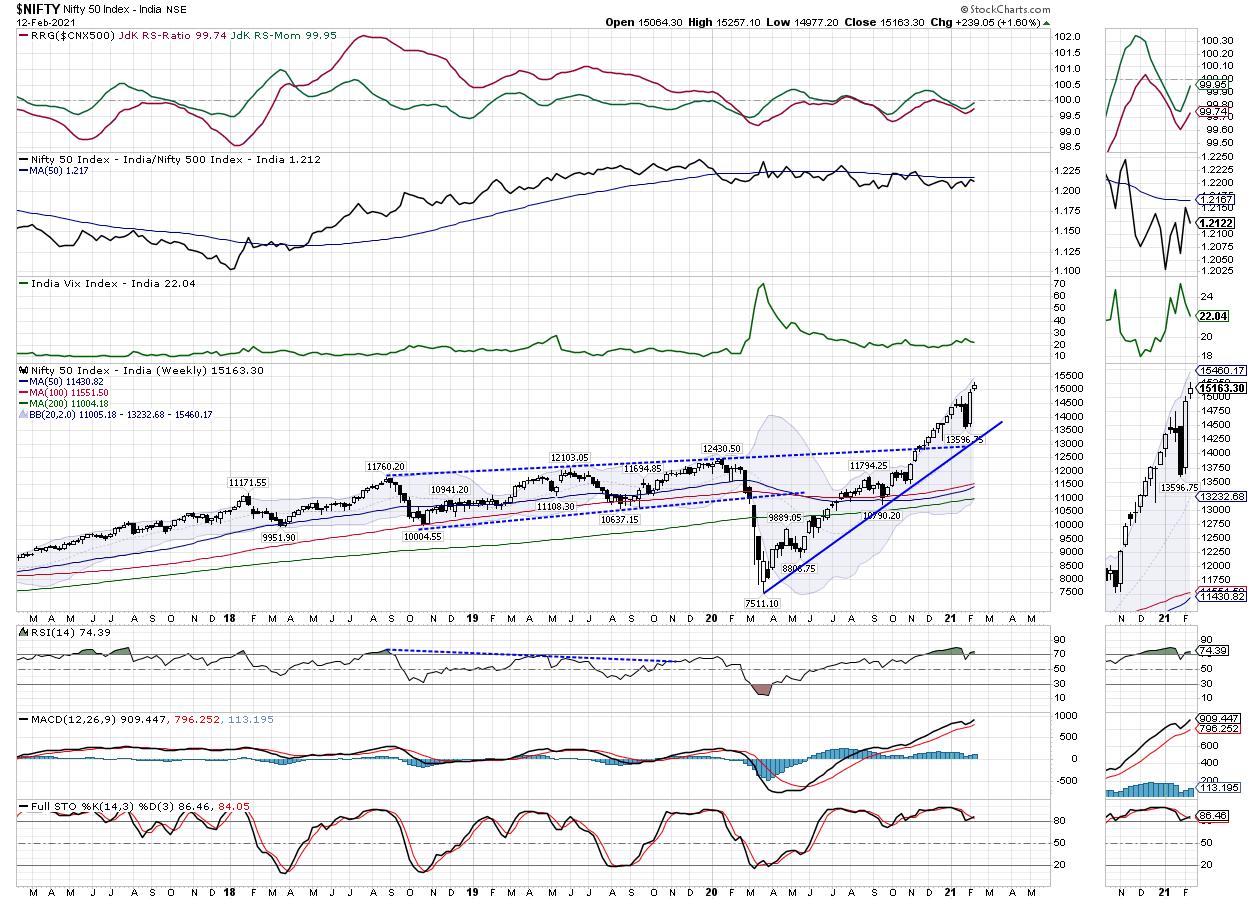
The weekly RSI is 74.39; RSI is not only in the overbought zone, but it also shows a negative divergence against the price. While the NIFTY has ended on a new 14-period high, the RSI has not. The weekly MACD is bullish and trades above the signal line. Apart from a small white body that occurred, no significant formation was noticed on the candles.
The pattern analysis on the chart shows that, once again, the NIFTY has runup much ahead of its curve, piling up over 2000 points with just one week of a corrective move. The nearest 20-Week MA is at 13232, nearly 2000 points below this level. The Index has been tracking the upper Bollinger band, which has widened a lot. Usually, these bands tend to adjust bringing the price once again within a broad and defined range.
Going ahead from here, another important thing that needs to be kept in mind is the non-confirmation of the market breadth. This breadth is not confirming new highs, which remains a concern. Overall, we recommend using all up moves, if there are any, to book profits and take some money off the table, rather than chasing the momentum through new purchases. Fresh purchases, if any should be kept in traditionally defensive stocks like Pharma, IT, FMCG and Consumption stocks, whose relative strength is gradually improving against the broader markets.
Sector Analysis for the Coming Week
In our look at Relative Rotation Graphs®, we compared various sectors against CNX500 (NIFTY 500 Index), which represents over 95% of the free float market cap of all the stocks listed.
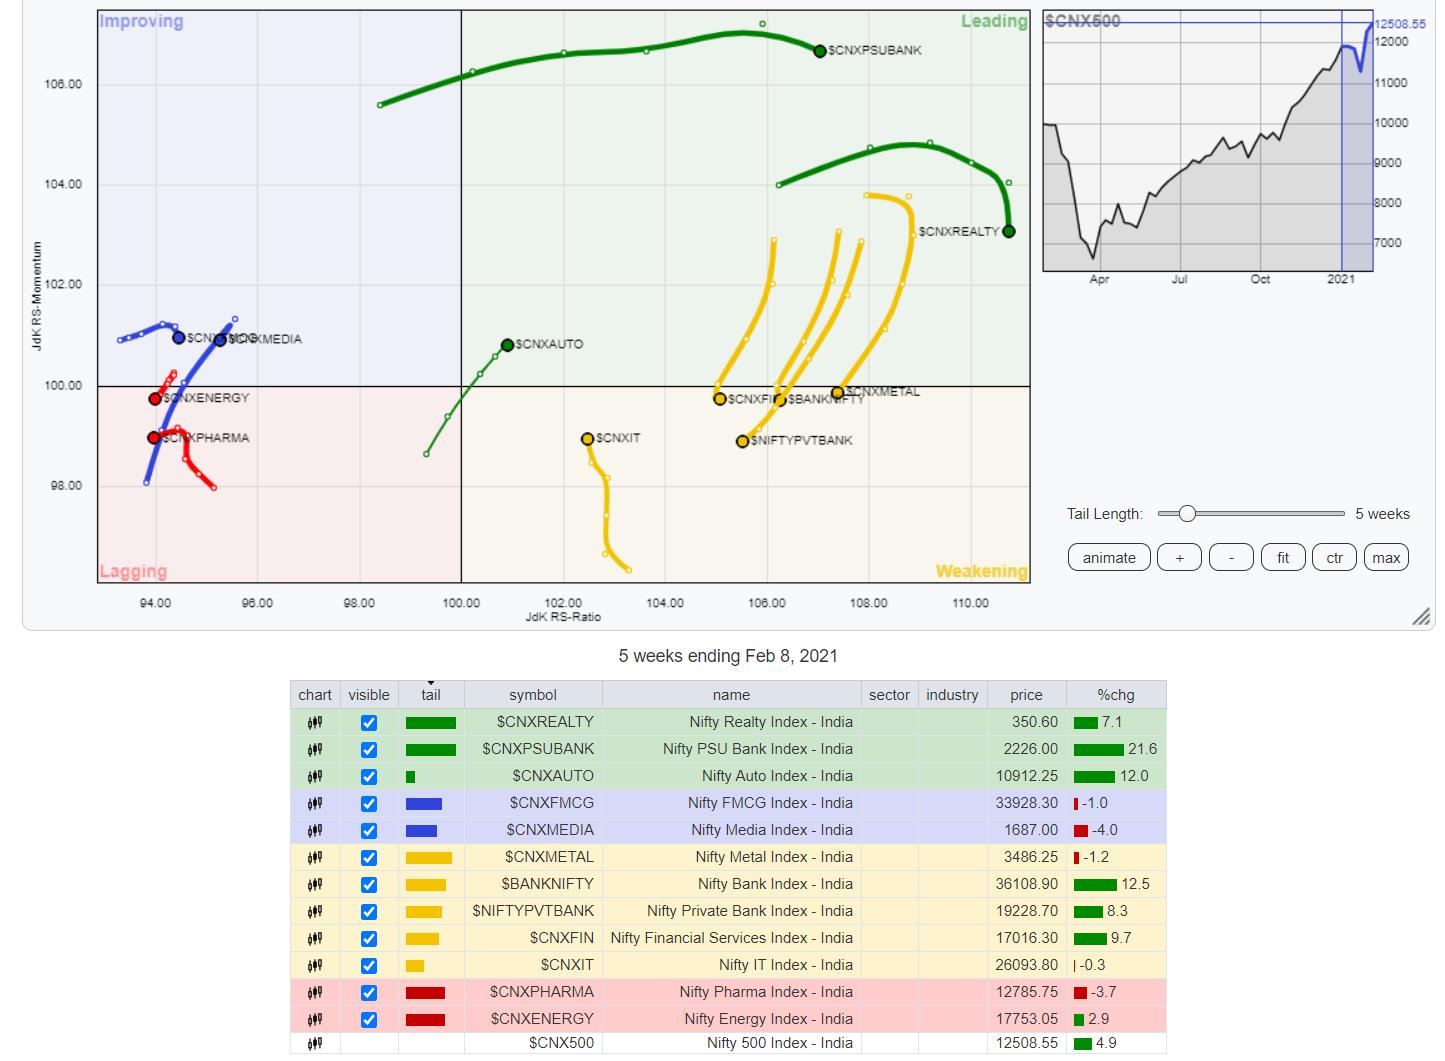
Our review of Relative Rotation Graphs (RRG) does not paint a strong picture. It is only the NIFTY PSUBank Index that is comfortably placed inside the leading quadrant, and is likely to relatively outperform the broader NIFTY500 index going ahead from here. Apart from this group, NIFTY Realty is the only sector in the leading quadrant. However, this group appears to be losing on its relative momentum.
NIFTY Metal and NIFTY Bank have drifted inside the weakening quadrant. This sector also has the NIFTY Services sector and the NIFTY MIDCAP 100 Index. These groups are rotating in the south-west direction and may continue to modestly underperform the broader markets.
The exception is the NIFTY IT Index, which is inside the weakening quadrant, but is showing a strong improvement in its relative momentum. It is moving in a vertical manner back towards the improving quadrant. This may cause a few IT stocks to show resilient performance in the coming week if this rate of change is maintained.
NIFTY Energy has rotated back inside the lagging quadrant. NIFTY Commodities, too, is inside the lagging quadrant, along with NIFTY Pharma. NIFTY Pharma may show some selective and isolated outperformance, but the other groups are seen languishing in the lagging quadrant.
The NIFTY Infrastructure index is inside the improving quadrant and appears to be steadily maintaining its rotation and relative momentum. NIFTY PSE and Media are showing strong negative rotation while being in the improving quadrant. The FMCG and Consumption also have shown some tiredness while being in the improving quadrant. However, these groups may post isolated outperformance given the defensive nature of this segment.
Important Note: RRG™ charts show the relative strength and momentum for a group of stocks. In the above chart, they show relative performance against NIFTY500 Index (Broader Markets) and should not be used directly as buy or sell signals.
Milan Vaishnav, CMT, MSTA
Consulting Technical Analyst,


