Over the past four trading sessions, the Indian equities continued to relatively underperform their global peers and ended the week on a modestly negative note. The previous week was a truncated one, as Wednesday was a trading holiday. The NIFTY had a similarly wide trading range as it oscillated in a 500-odd points range before closing on a negative note. The first day of the week was saw the markets closing deep in the red; the subsequent three trading days saw the index staging a pullback rally. Following such volatile moves, the headline index ended with a net loss of 217 points (-1.46%) on a weekly basis.
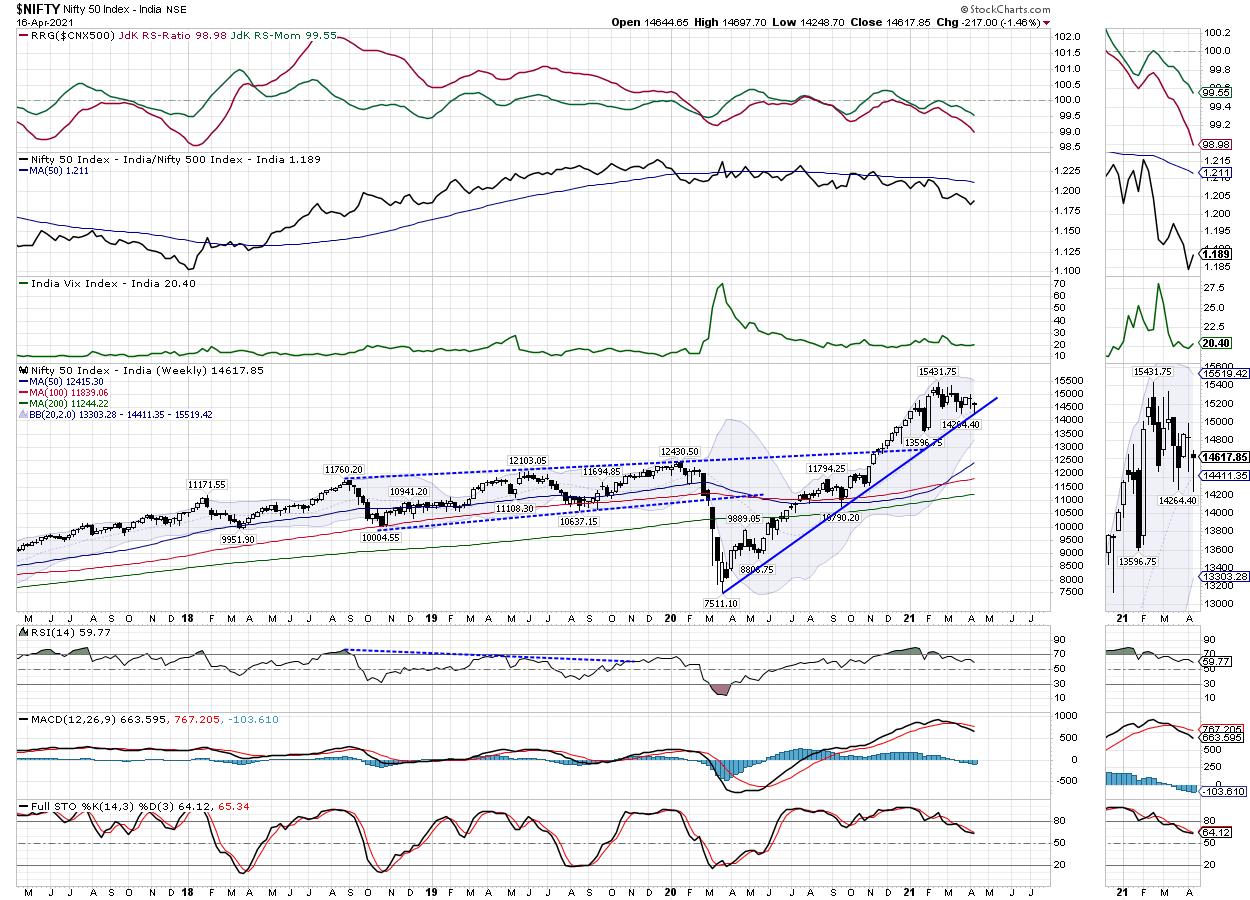
From a technical perspective, the week was especially important. The NIFTY violated the 20-Week MA, which presently stands at 14411. Though the Index managed to close above this level, but a violation of this level will also translate into violating of a rising trend line drawn from the lows of the previous year. Secondly, the NIFTY has formed a lower top and a lower bottom on the charts; both remain Doji candles, which indicates indecisiveness and potential weakness. The volatility increased marginally as the INDIAVIX rose by 3.12% to 20.40. Maintaining levels above 14400 would be of critical importance for the markets not only in the next week, but over subsequent weeks as well.
Just like the earlier one, the coming week is also an truncated one, with Wednesday being a trading holiday on account of Ram Navmi. It is expected that the levels of 14735 and 14900 will act as immediate resistance points. The supports come in at 14400 and 14280 levels. Any violation of the 14400 level will make the trading range wider than usual.
The weekly RSI is 59.77; it has made a new 14-period low, which is bearish. The weekly MACD is bearish; it remains below its signal line. A Doji appeared on the candles. This is the second such Doji that has appeared back-to-back, but the bar also has a lower top and a lower bottom. So, both indecisive behavior and some mild weakness is seen on the charts.
The NIFTY has defended the 20-Week MA, which stands at 14411. This level is of crucial importance for the coming weeks; any violation of this level by NIFTY will also mean violation of the rising trend line drawn from the lows of the year 2020. In other words, keeping its head above 14400 will be critically important for the Index.
The previous week has seen moderate increase in volatility; the coming days will see volatility increasing again. The defensive stocks like Pharma, IT and FMCG showed a resilient performance; this texture is likely to stay over the coming days. Rather than chasing up moves, if any, it is recommended you continue staying highly stock-specific and adopt a highly cautious approach towards the markets.
Sector Analysis for the Coming Week
In our look at Relative Rotation Graphs®, we compared various sectors against CNX500 (NIFTY 500 Index), which represents over 95% of the free float market cap of all the stocks listed.
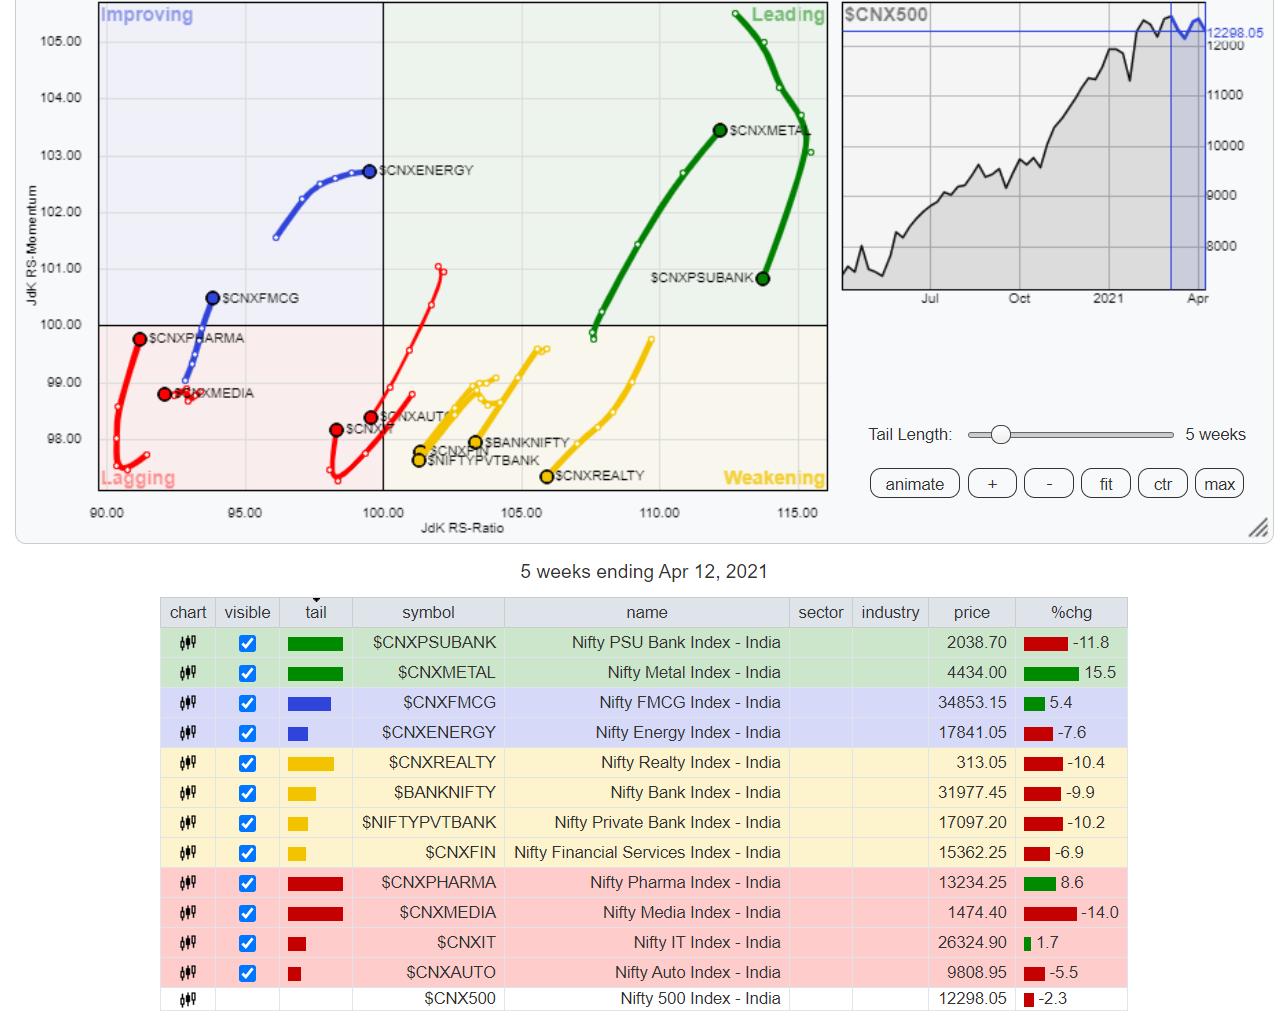
The review of Relative Rotation Graphs (RRG) does not show any change in the sectoral setup as compared to what was seen over the previous week. The NIFTY Commodities, Metal, and Midcap100 Indexes have continued to surge ahead while staying firm in the leading quadrant. All these groups are likely to relatively outperform the broader markets. The PSUBANKS Index, Infrastructure, PSE and the Small Cap Index are losing their relative momentum despite being in the leading quadrant.
The NIFTY Services sector, Financial Services Index, NIFTY Bank Index and Realty Index are in the weakening quadrant; they are continuing to lose its relative momentum while rotating in the south-west direction.
The NIFTY Auto Index has rolled inside the lagging quadrant. This is likely to relatively underperform the broader markets along with NIFTY Media Index, which also continues to languish in the lagging quadrant. The NIFTY Pharma Index is also inside the lagging quadrant; however, it appears to be sharply improving on its relative momentum, along with the FMCG Index and the IT Index.
NIFTY FMCG has rolled inside the improving quadrant. This hints at a likely end to relative underperformance of the sector. The ENERGY Index is inside the improving quadrant and appears to be maintaining its relative momentum against the broader markets.
Important Note: RRG™ charts show the relative strength and momentum for a group of stocks. In the above chart, they show relative performance against NIFTY500 Index (Broader Markets) and should not be used directly as buy or sell signals.
Milan Vaishnav, CMT, MSTA
Consulting Technical Analyst,


