In a week where the trading range stayed narrower than the earlier week, the Indian equities saw a corrective decline. The current week was also a truncated one with just four trading sessions. The headline index saw itself oscillating in a 375-point range. Though the range stayed less wide, the intraday volatility and ranged oscillations remain high. The NIFTY only stayed in the falling channel that it has formed, but also refused to take any directional cue during the week. Following a volatile trading week, the benchmark index finally ended with a net loss of 276.50 points (-1.89%) on a weekly basis.
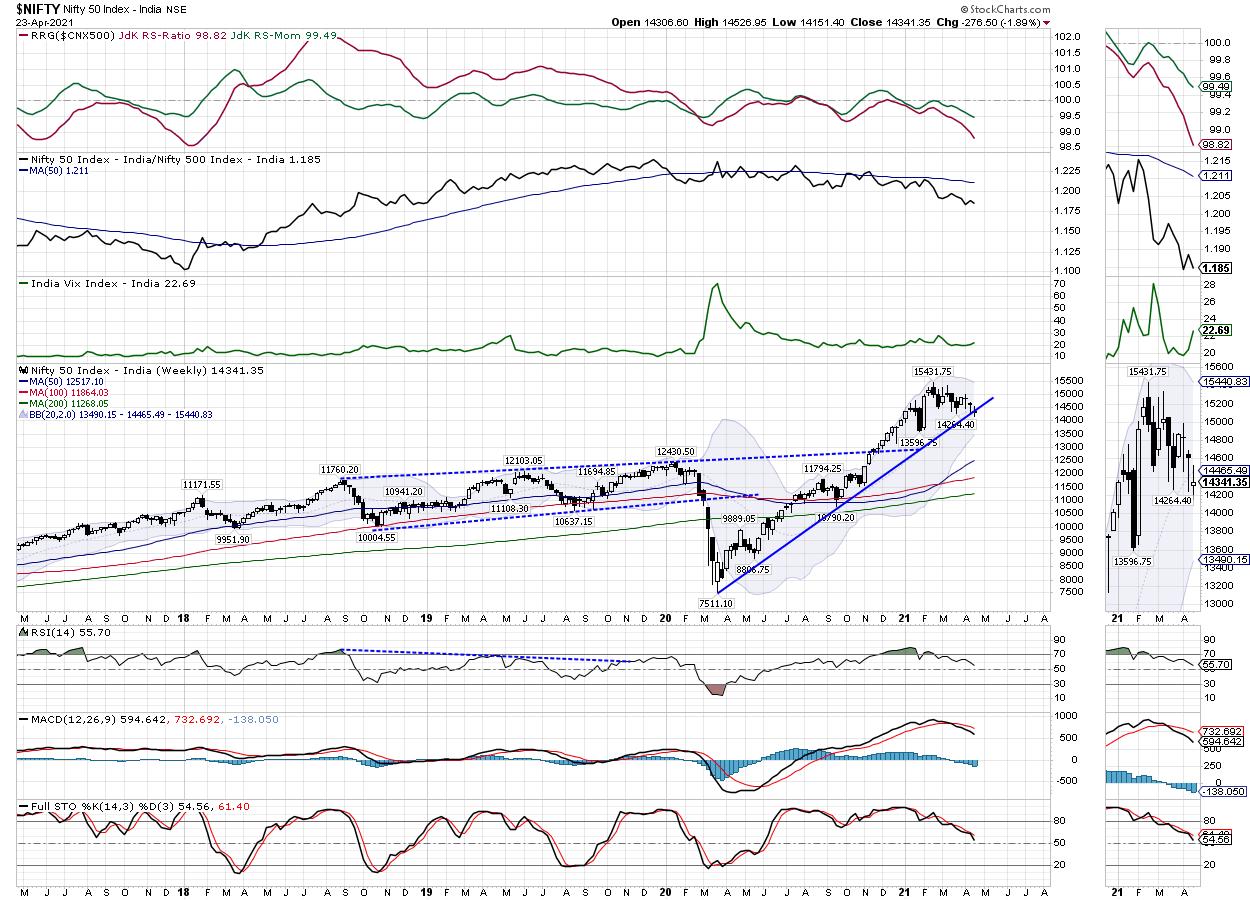
Despite a narrower trading range, the most recent move on the NIFTY is a bit of a technically damaging one on the weekly charts. In the previous weekly note, it was mentioned that the NIFTY had violated the rising trend line pattern support, but managed to bounce off that trend line. This trend line is a major pattern support, drawn from the lows made in March 2020, which joins the subsequent higher bottoms until today. However, the recent price action has seen the Index violating this important pattern trend line support. This has also dragged the Index's resistance points considerably lower to 14500-14600.
NIFTY has also violated and closed below the 20-week MA, which currently stands at 14465 and was acting as a proxy trend line for the NIFTY.
The coming week may see the markets trading on a subdued note; NIFTY moving past the 14500 levels would be extremely crucial. The levels of 14450 and 14600 will act as resistance points; the supports will come in at 14200 and 14000 levels.
The weekly RSI is 55.70; it has made a fresh 14-period low, which is bearish. The RSI does not show any divergence against the price. The weekly MACD is bearish and trades below its signal line. A spinning top occurred on the candles. Such a formation occurs when there is little market action and little difference between the open and the close price. It also reflects a lack of directional consensus among the market participants.
The front-line indexes are likely to relatively underperform the broader markets. The Relative Strength line of NIFTY and BankNIFTY against the broader NIFTY500 Index is declining. This does not mean that both NIFTY and BankNIFTY would decline; they may continue to perform individually, but against the broader markets, they would continue to relatively underperform.
Given the present technical setup, it is strongly recommended to continue staying highly stock-specific in approaching the markets. Even if the NIFTY tests the 14000 level on the downside, it will still stay within the falling channel. It would be prudent to continue protecting profits on either side, rather than waiting for the markets to establish and definite directional bias. An extremely cautious approach is advised for the coming week.
Sector Analysis for the Coming Week
In our look at Relative Rotation Graphs®, we compared various sectors against CNX500 (NIFTY 500 Index), which represents over 95% of the free float market cap of all the stocks listed.
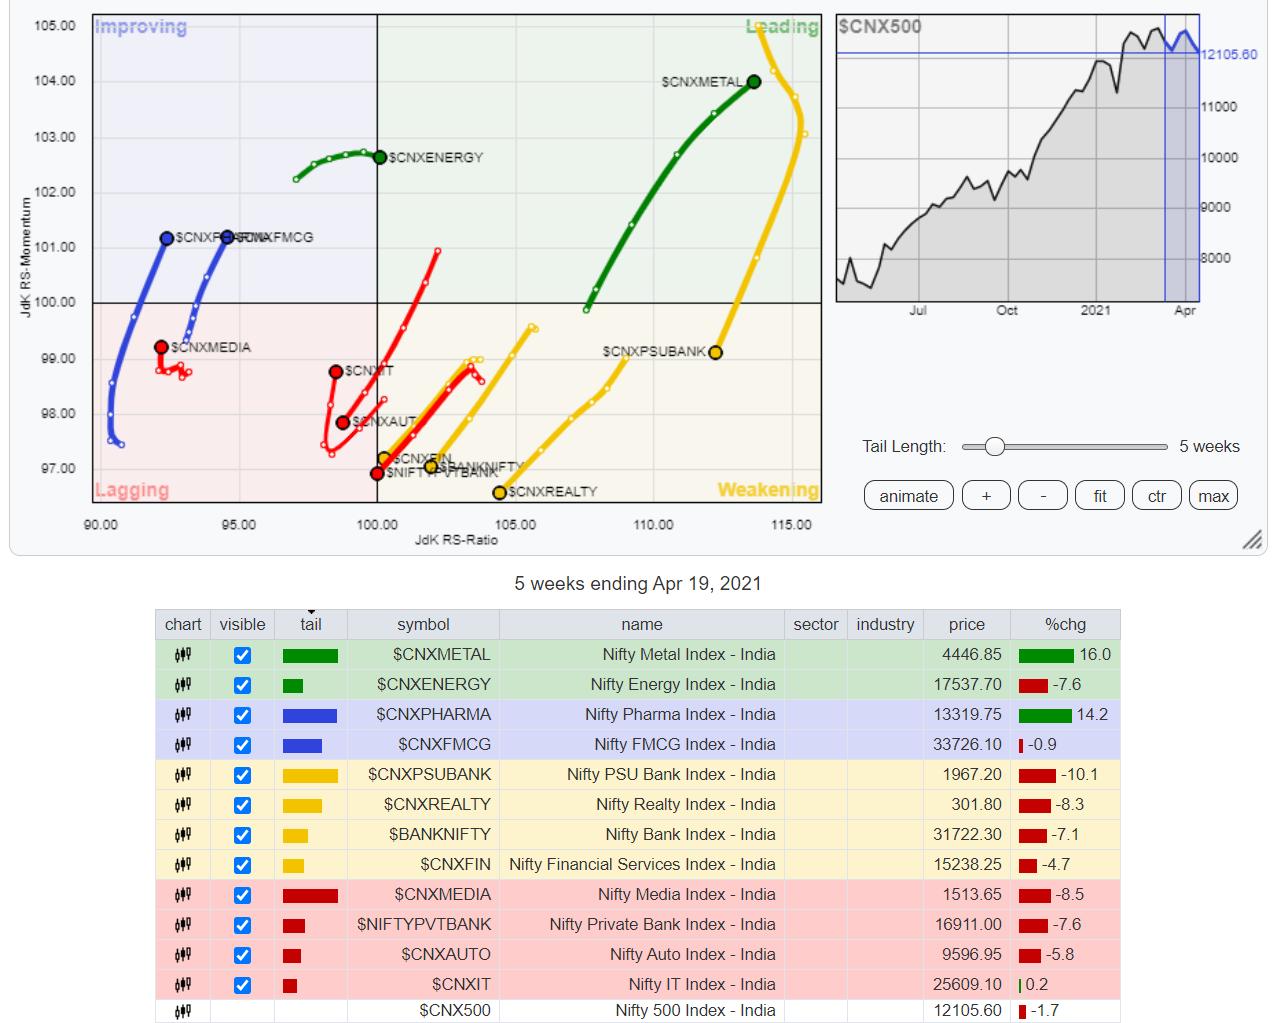
Our review of Relative Rotation Graphs (RRG) NIFTY Metal, Commodities and MIDCAP 100 Indexes are firmly placed inside the leading quadrant and appear to be maintaining their relative momentum against the broader markets. These groups are likely to relatively outperform the broader markets along with the NIFTY Energy Index, which has rolled over inside the leading quadrant. Small Cap, Infrastructure and the PSE groups are also inside the leading quadrant, but they appear to be taking a breather while modestly paring their relative momentum.
The NIFTY Financial Service Index, Realty Index and NIFTY Bank remain in the weakening quadrant, maintaining their southwest direction while giving up their relative momentum. The PSU Bank index also has rolled inside the weakening quadrant, indicating a likely end to its relative outperformance against the broader markets.
The NIFTY Services sector has rolled inside the lagging quadrant. Along with this, the NIFTY Auto Index also continues to languish inside the lagging quadrant. The Media group is also placed inside this quadrant. These sectors are likely to continue to relatively underperform the broader markets.
The Consumption and IT Indexes are also inside the lagging quadrant, but they appear to be improving on their relative momentum. The FMCG index has advanced further inside the improving quadrant.
Important Note: RRG™ charts show the relative strength and momentum for a group of stocks. In the above chart, they show relative performance against NIFTY 500 Index (Broader Markets) and should not be used directly as buy or sell signals.
Milan Vaishnav, CMT, MSTA
Consulting Technical Analyst,


