In a week that remained technically important, the markets pulled up from the lows that were marked in two previous weeks. The NIFTY saw a narrower trading range than the week prior. The index oscillated in a 446-point range over the past five sessions and remained largely trending on the upside. Except for some intraday intermittent hiccups, the market largely edged higher. Though it stayed within the falling channel following a relatively quiet and less volatile week, the headline Index ended with a net gain of 192.05 points (+1.31%) on a weekly basis.
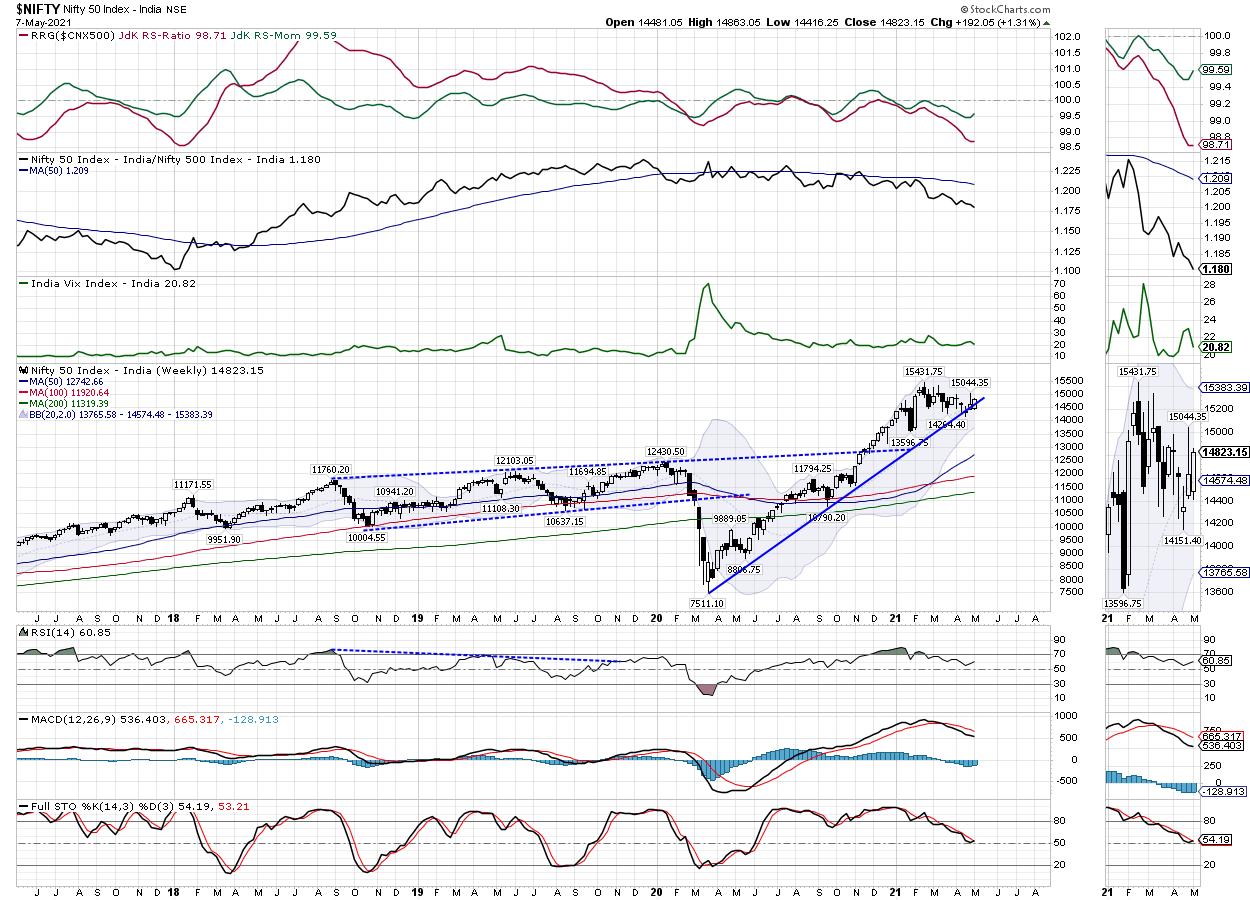
Over the past sessions, the NIFTY had violated the important rising trend line support; this trend line was drawn from the lows of March 2020, which joined the subsequent higher bottoms. However, the price action over the past couple of days has seen the Index trying to move above this trend line again. From the technical perspective, this would be important; if the NIFTY stays above this rising trend line, then we may even see the Index testing the upper edge of the falling channel. As of now, the NIFTY has averted any major weakness; it would be crucially important for the NIFTY to keep its head above 14500 to avoid any incremental weakness.
Contrary to expectations, the volatility reduces significantly. The INDIAVIX declined by 9.58% to 20.82 on a weekly note. The coming week may see a stable-to-mildly positive start to the week. The levels of 15000 and 15200 will act as resistance; supports will come in at 14600 and 14480 levels. The trading range over the next five days is likely to stay wider than usual. The coming week is a truncated one again, with Thursday being a trading holiday on account of Id-Ul-Fitr (Ramzan Id).
The weekly RSI is 60.85; it remains neutral and does not show any divergence against the price. The weekly MACD is bearish and currently it is below its signal line. A white body occurred on the candles; this showed directional consensus among the market participants during the week.
Overall, the market has continued its corrective retracement. It remains within a falling channel; however, it had slipped below the upward rising support trend line, while being inside the small falling retracement channel that was formed after the NIFTY marked its lifetime high at 15431. This trend line begins from the low point seen in March 2020 and joins the subsequent higher bottoms.
Broadly speaking, it is quite likely that the markets, in general, may continue to exhibit a tentative or defensive approach so long as the NIFTY is below the 15000 levels. We recommend that, so long as the Index is below the 15000 level, all moves on the upside should be utilized to protect profits and take some money off the table. Until then, all fresh purchases should be kept limited to low beta and defensive sectors and stocks. Once above 15000 levels, some high beta buying can emerge; however, until then, a highly defensive and cautious approach is advised for the coming week.
Sector Analysis for the Coming Week
In our look at Relative Rotation Graphs®, we compared various sectors against CNX500 (NIFTY 500 Index), which represents over 95% of the free float market cap of all the stocks listed.
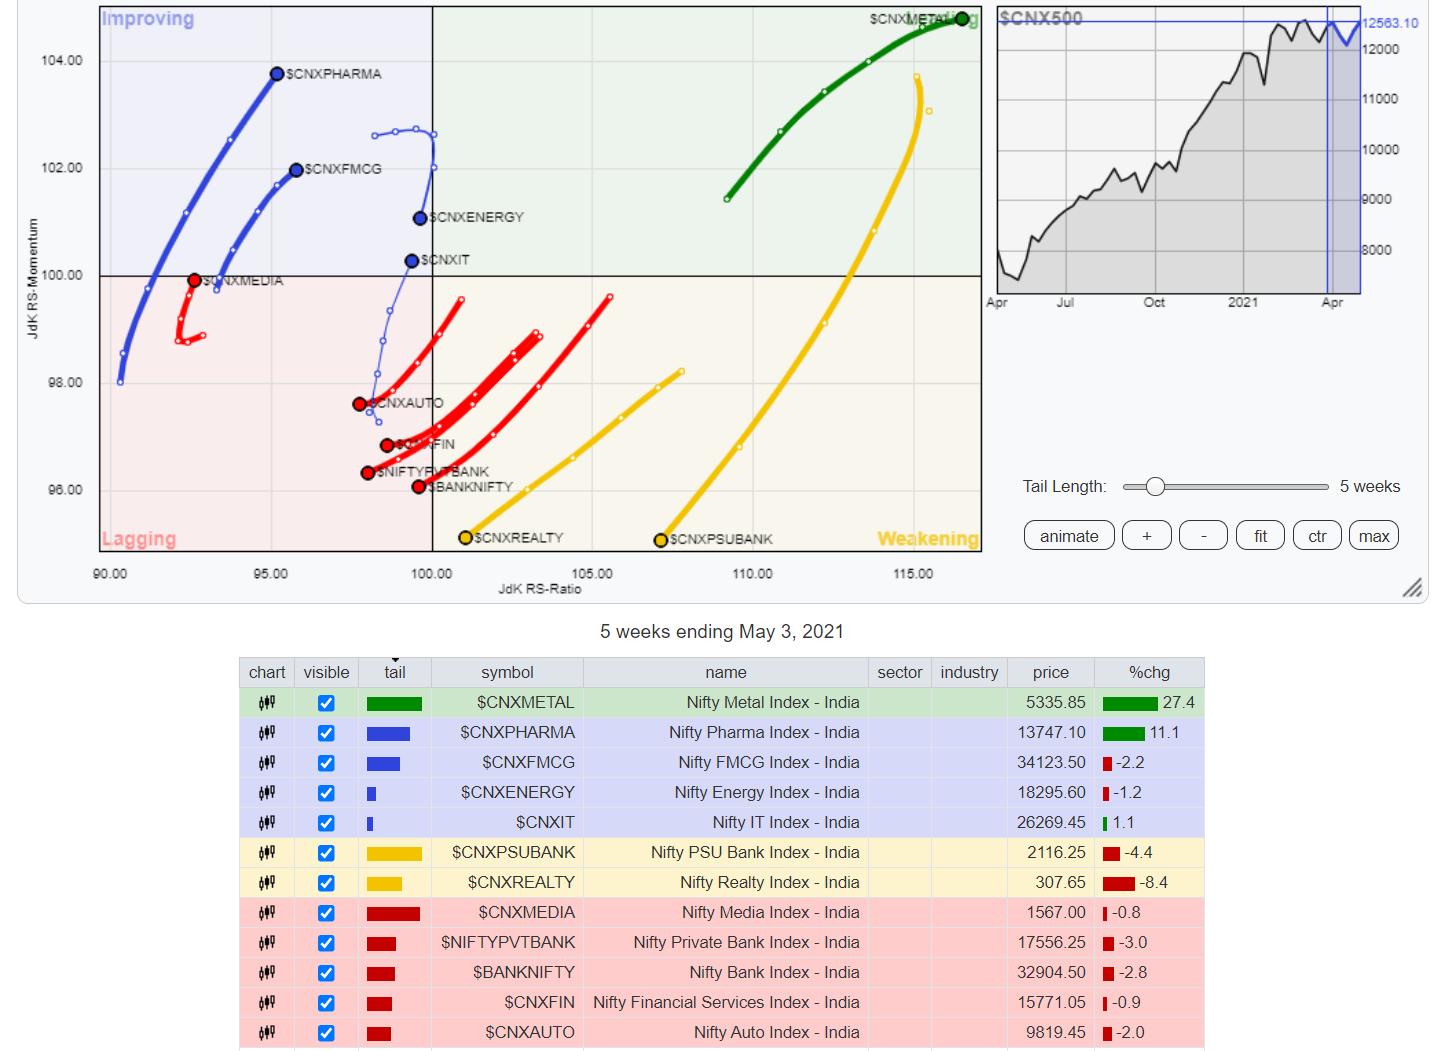
The review of Relative Rotation Graphs (RRG) shows that NIFTY Metal, Commodities and the Small Cap Index remain in the leading quadrant and are seen maintaining their relative momentum. Apart form this, the NIFTY MIDCAP100 and NIFTY PSE are also inside the leading quadrant; however, both indices are seen taking a breather and paring their relative momentum against the broader NIFTY500 Index.
The NIFTY Infrastructure index has slipped inside the weakening quadrant. The NIFTY PSU Banks and REALTY Indexes are seen continuing to pare their relative momentum while being placed inside the weakening quadrant.
The NIFTY Bank has rolled over inside the lagging quadrant. The NIFTY Services Sector, Auto and Financial Services Index are also seen languishing inside the lagging quadrant. The NIFTY Media Index is also inside the lagging quadrant; however, it is seen improving its relative momentum.
The NIFTY Consumption Index has moved inside the improving quadrant, marking a likely end to its relative underperformance. The Energy Index has made a negative rotation and has moved inside the improving quadrant following a southwest rotation from the leading quadrant. The NIFTY Pharma Index appears to be firmly placed inside the Improving quadrant. Along with the Consumption Index, the NIFTY IT Index has also rolled over inside the improving quadrant. These stocks are likely to relatively outperform the broader markets.
Important Note: RRG™ charts show the relative strength and momentum for a group of stocks. In the above chart, they show relative performance against NIFTY500 Index (Broader Markets) and should not be used directly as buy or sell signals.
Milan Vaishnav, CMT, MSTA
Consulting Technical Analyst,


