The NIFTY Realty Index is showing strong technical setup on both its Daily and Weekly charts. Some sector rotation is clearly evident and the sector is showing strong Relative Strength against the broader markets.
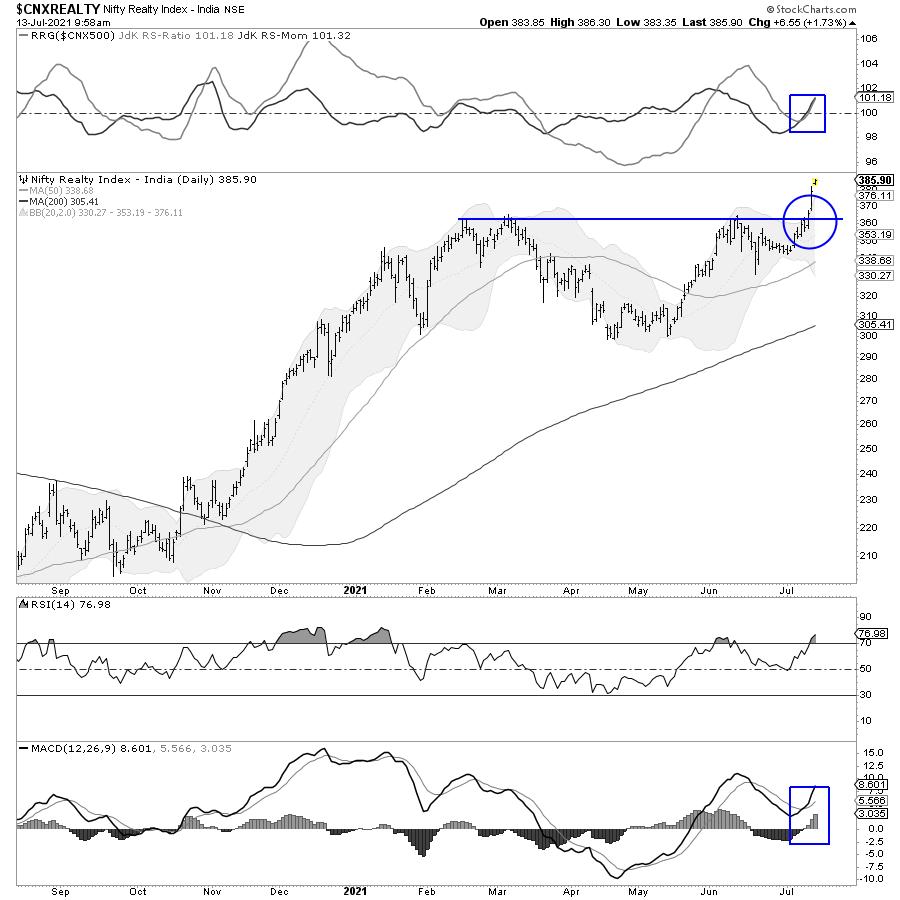
The Daily Chart of the NIFTY Realty Index show a strong breakout above 360. Even if some consolidation happens, the breakout shall remain in force so long as the Index keeps its head above the 360 level.
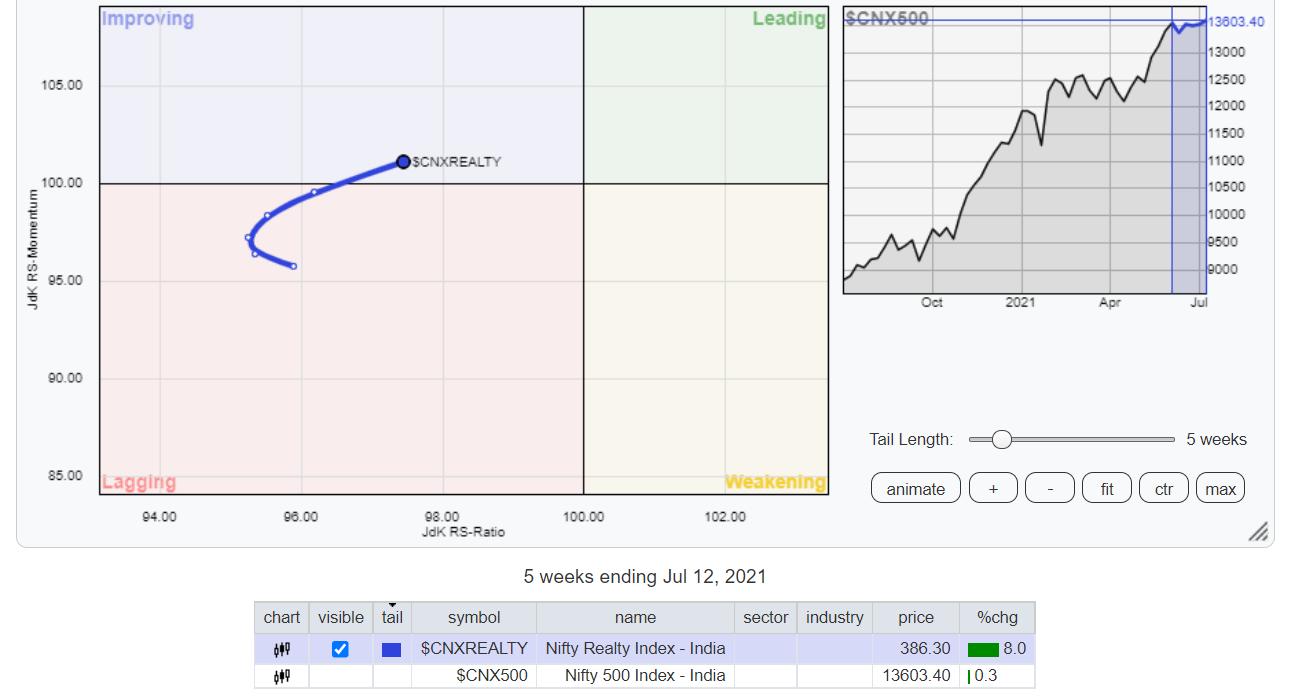
When benchmarked against the broader NIFTY 500 Index, the Realty Index has rolled inside the improving quadrant. This hints at a likely end to its relative underperformance. A strong improvement in the Relative Strength of this sector against the broader markets cannot be ruled out.
Interesting fact: Two stocks, DLF.in and GODREJPROP.in, have 25.81% and 24.22% weight respectively in the index and collectively make 50.03% of the Realty Index. Add two stocks more - OBEROIRLTY.in and PHOENIXLTD.in with 11.68% and 11.23% weight respectively - which add up another 22.91%. The top four stocks thus make 72.94% of the Index.
If the Realty Index is to make any significant moves, the contribution from these four constituents will be imminent; give the total 72.94% weight in the Index. Let us see what the charts say about these stocks.
DLF.in
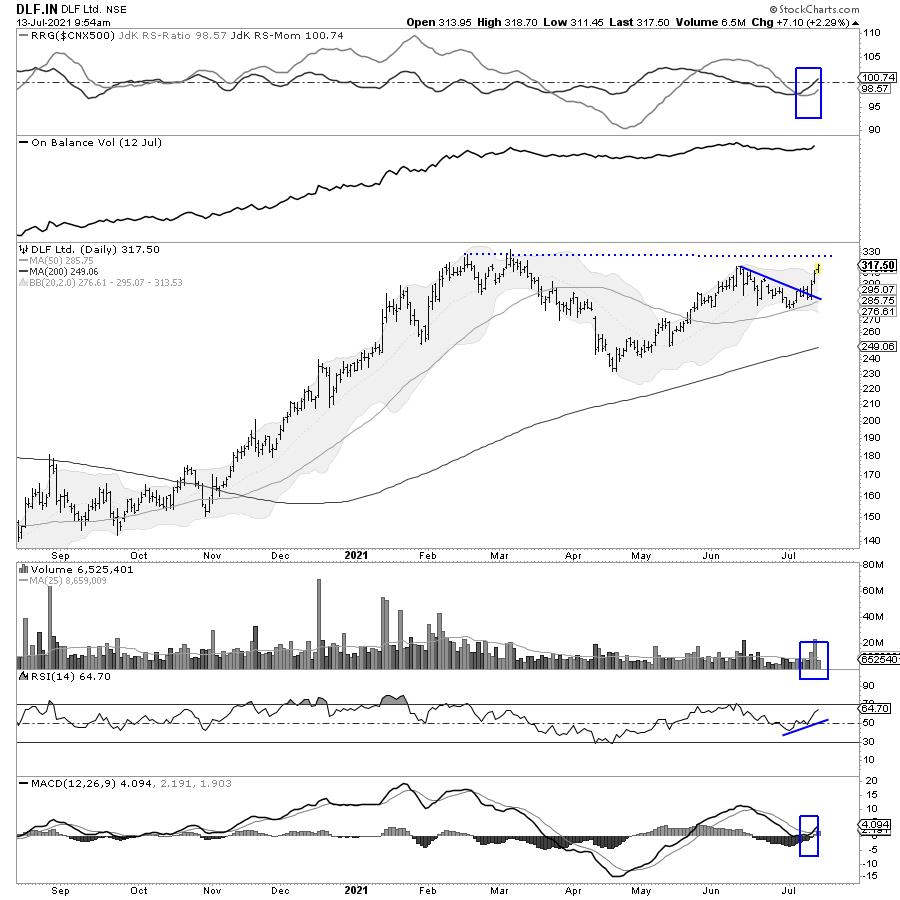
DLF is approaching a major resistance area near 330. The current up move remains intact and the possibility of the stock testing these levels cannot be ruled out. A breakout above the area can be anticipated from the present technical setup. The RSI has marked a new 14-period high, which is bullish. OBV is already marking incremental highs. Volumes during the up-moves have stayed above the 25-day average. If the present setup is resolved on expected lines, the possibility of the stock testing the 340-345 levels cannot be ruled out over the coming week.
GODREJPROP.in
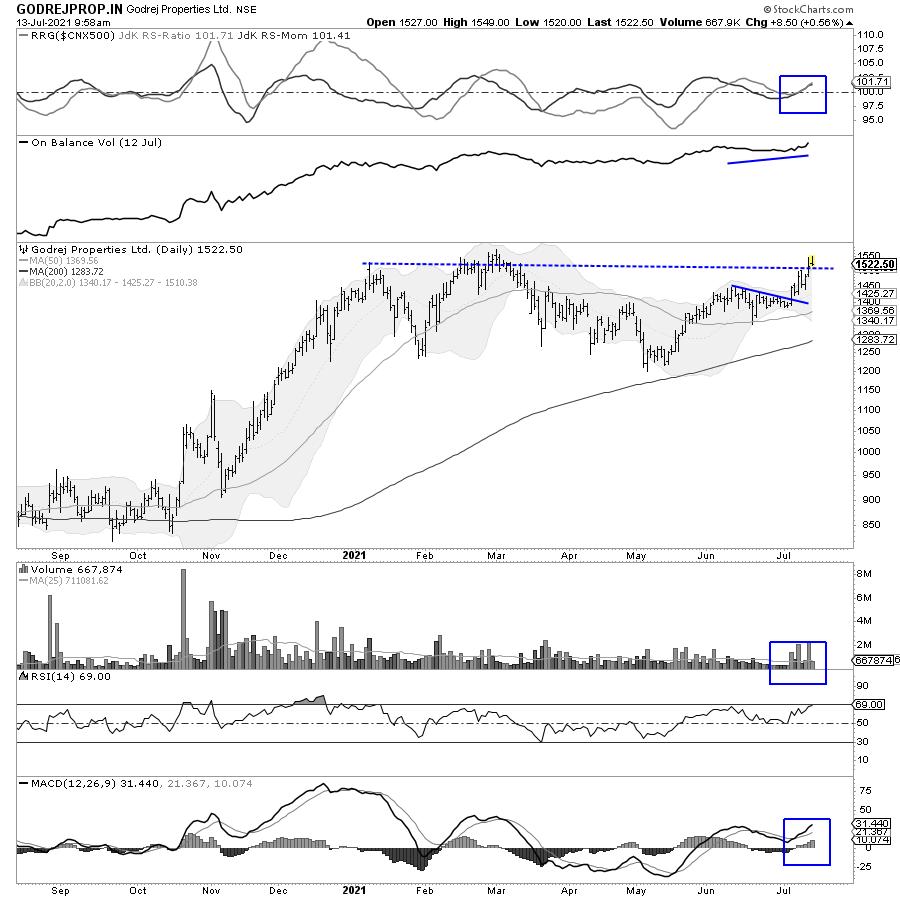
GODREJPROP has already attempted a breakout above the 1500-level, which has been acting as a multi-point resistance level after the stock tested its high in early 2021. The OBV marked its high well ahead of the actual breakout. The RSI has also marked a fresh 14-period high; it remains neutral and does not show any divergence against the price. While the MACD is bullish, the stock is inside the leading quadrant of the RRG. If the breakout sustains, and if the stock does not slip below 1475, the levels of 1615-1630 can be expected over the coming weeks.
OBEROIRLTY.in

OBEROIRLTY.in finally broke out after staying sideways for nearly five months. The OBV has hit a new high, which acts as a confirmation on the volume front. The up-moves came with higher volumes, which were strong and above the 25-day average. The stock is in the overbought territory; however, this itself shows that the underlying momentum is strong. Some consolidation is expected here, but, so long as the stock stays above 660 levels, it may test the 735-750 levels over the coming days.
PHOENIXLTD.in
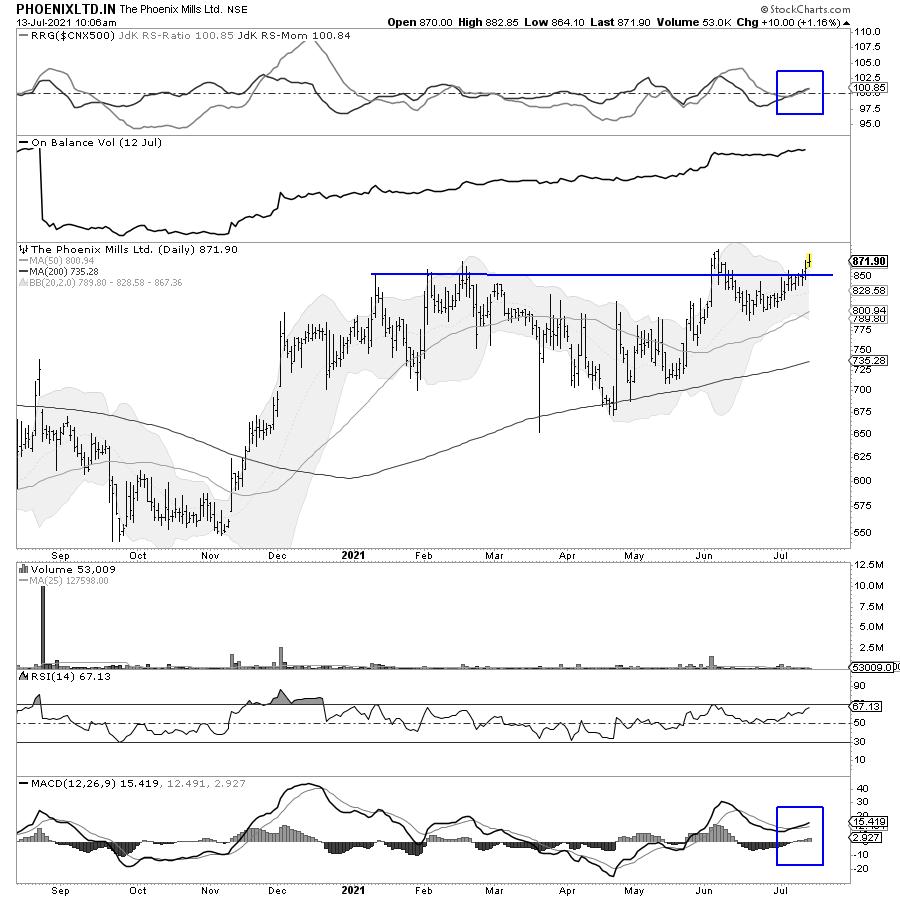
PHOENIXLTD has also broken out after months of sideways consolidation. The stock marked its high in early 2021. The stock did attempt to move past the high point near 850, but it failed to make any meaningful breakout and ended up marking just incremental highs. PHOENIXLTD has attempted a breakout again. It closed above the upper Bollinger band; this further increases the possibility of a sustainable breakout taking place. The MACD has shown a positive crossover, and the stock has rolled inside the leading quadrant of RRG when benchmarked against broader NIFTY500 Index. If the present breakout stays intact, the stock may test the 935-960 levels over the coming weeks.
Milan Vaishnav, CMT, MSTA
Consulting Technical Analyst
Disclosure pursuant to Clause 19 of SEBI (Research Analysts) Regulations 2014: Analyst, Family Members, or his Associates holds no financial interest below 1% or higher than 1% and has not received any compensation from the Companies discussed.
The securities discussed and opinions expressed in this report may not be suitable for all investors, who must make their own investment decisions, based on their own investment objectives, financial positions, and needs of specific recipients. This may not be taken in substitution for the exercise of independent judgment by any recipient.
The recipient should independently evaluate the investment risks. The value and return on investment may vary because of changes in interest rates, foreign exchange rates, or any other reason. Past performance is not necessarily a guide to future performance. The usage of the Research Reports and other Services are governed as per the Terms of Service on https://equityresearch.asia/terms-of-use
The Research Analyst has not managed or co-managed the issues of any of the companies discussed and has not received any such remuneration from such activities from the companies discussed.
The Research Analyst has not received any remuneration from the Merchant Banking activities.
The Research Analyst has adopted an independent approach without any conflict from anyone. The Research Analyst has not received any compensation or other benefits from the companies mentioned in the report or third party in connection with the preparation of the research report.
Compensation of the Research Analysts is not based on any specific merchant banking, investment banking or brokerage service transactions.
The Research Analyst is not engaged in a market-making activity for the companies mentioned in the report.
The Research Analyst submits that no material disciplinary action has been taken on him by any Regulatory Authority impacting Equity Research Analysis activities.
This report is not directed or intended for distribution to, or use by, any person or entity who is a citizen or resident of or located in any locality, state, country, or other jurisdiction, where such distribution, publication, availability, or use would be contrary to law, regulation or which would subject the Research Analyst to any registration or licensing requirement within such jurisdiction.


