In the previous weekly note, it was mentioned that, although the markets are due for some range-bound consolidation, defending the zone of 16300-16450 will be crucial for the NIFTY. Over the past five days, the NIFTY kept marking intermittent highs with some consolidation in between. During some interim profit-taking pressure, the NIFTY took support near 16400 as it formed its week's low at 16395.70 on the expected lines. The week saw the trading range of 326-odd points, with the Index oscillating with inherently buoyant bias. While closing at its lifetime high point once again, the headline index ended with net gains of 254.70 points (+1.55%) on a weekly basis.
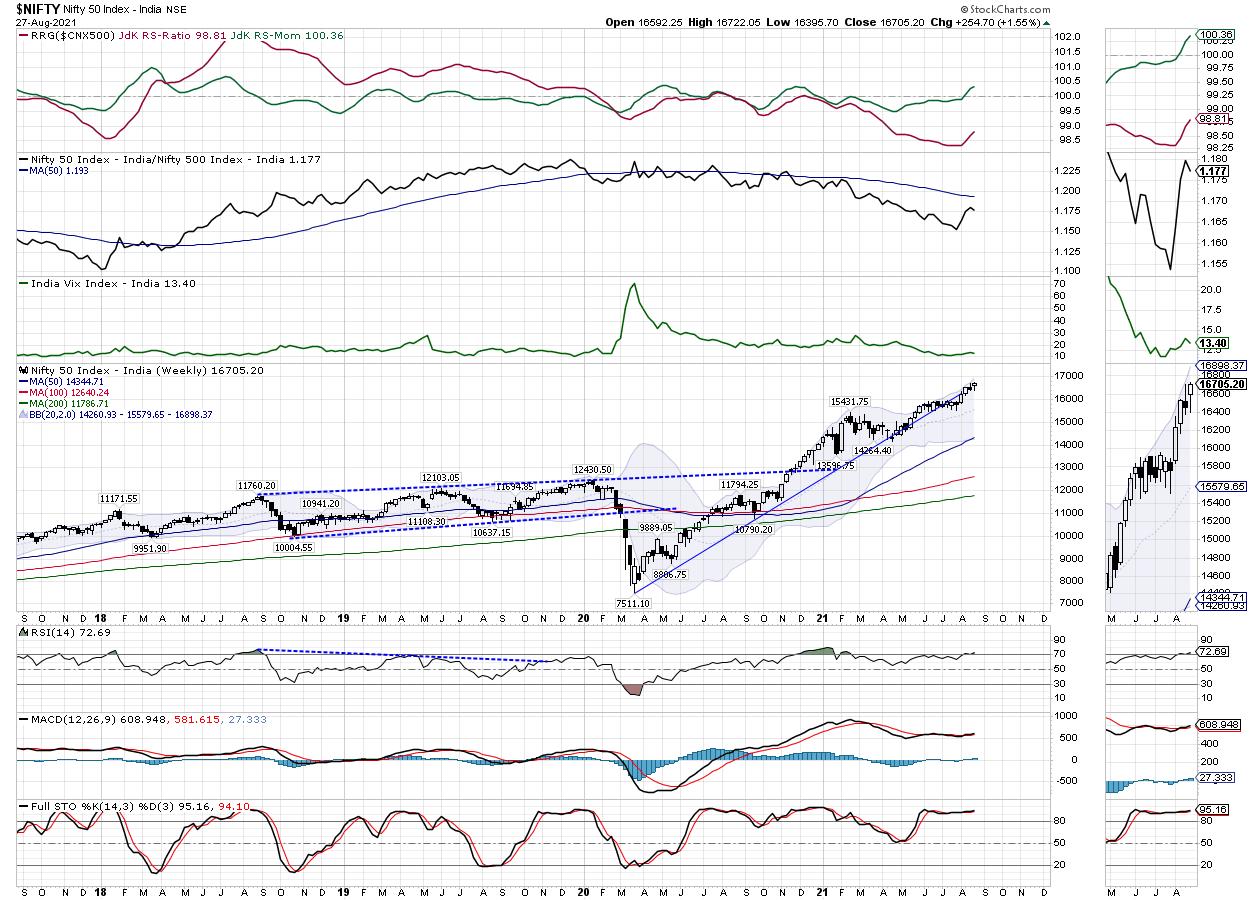
Given the kind of addition of PUT OI (Put writing) happening at 16500 and 16600 strikes, it is evident that the NIFTY will not have any major downsides in the event of any corrective move taking place. Going by the overall F&O data, the Index is likely making some more room on the upside. It would not be a surprise if the NIFTY tests the 16800-16890 level over the coming days. In order to do this, the NIFTY keeping its head above 16600 will be crucial. The volatility has been reduced; INDIAVIX came off by 4.35% to 13.40.
The new week may see a positive start; the levels of 16790 and 16885 will act as likely immediate resistance points. The supports exist at 16600 and 16480 levels.
The weekly RSI is 72.69; it has marked a new 14-period high, which is bullish. RSI remains mildly overbought and neutral while not showing any divergence against the price. The weekly MACD is bullish and still above the signal line. A candle with a slightly long lower shadow emerged. The lower shadow is not long enough to make it predominantly bearish, but it warrants vigilant protection of profits at higher levels, just in case if we see the markets consolidating again in the defined range.
The pattern analysis shows that, after staging a breakout above the 15900-15950 levels, the NIFTY has extended its up move with some range-bound consolidation in between. While there is still some room on the upside, the zone of 16350-16400 will act as immediate short-term support levels for the NIFTY.
The NIFTY September series futures have added over 10.20 lakh shares, or a massive 8.24% in Net Open Interest. This coming with the up move in the markets show an addition of fresh longs in the system, which inherently exhibits a positive undercurrent. Though the markets have some more room left on the upside, we recommend continuing to stay highly stock-specific in approaching the markets. The sectors like banks, which have been laggards over the past week, may relatively outperform the broader markets along with select large-caps and some good quality stocks from the broader universe. A positive outlook with vigilant protection of profits is advised for the coming week.
Sector Analysis for the Coming Week
In our look at Relative Rotation Graphs®, we compared various sectors against CNX500 (NIFTY 500 Index), which represents over 95% of the free float market cap of all the stocks listed.
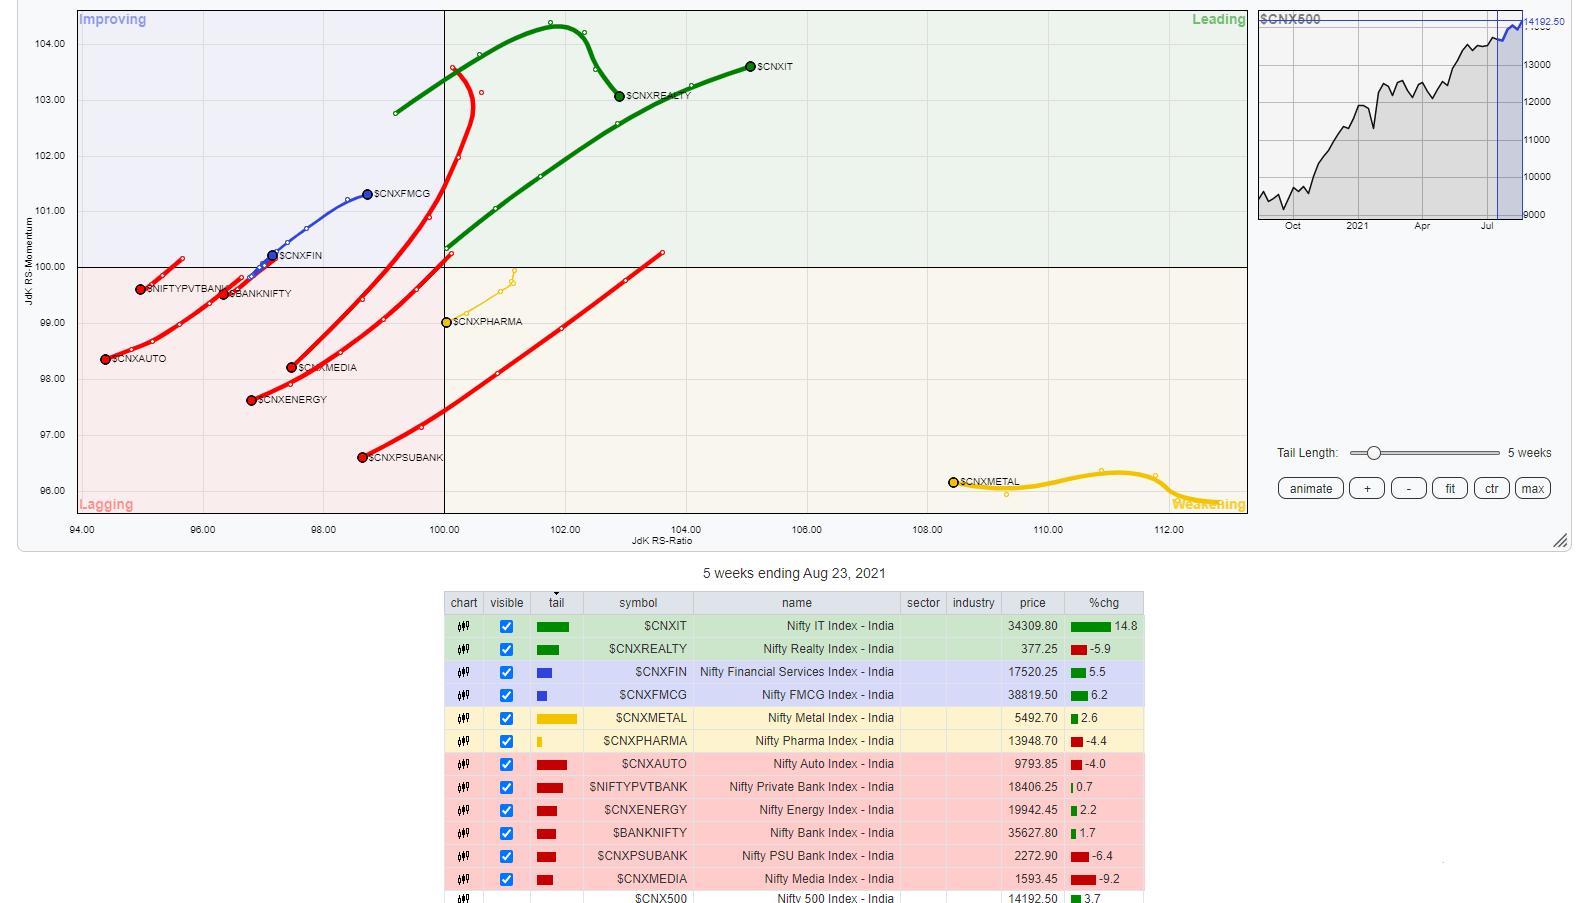
The analysis of Relative Rotation Graphs (RRG) shows that the NIFTY IT and the Realty Index remain firmly placed inside the leading quadrant and are likely to continue to relatively outperform the broader markets. The Small Cap index is also inside the leading quadrant; it may show isolated moves as the index appears to be paring its relative momentum.
The NIFTY Commodities, Pharma, PSE, Metal, and NIFTY MidCap 100 Indexes are inside the weakening quadrant. They may continue to relatively underperform the broader NIFTY500 Index.
NIFTY Auto and NIFTY Energy continue to languish inside the lagging quadrant, along with NIFTY Media, Infrastructure and the PSU Bank Index. These groups may broadly underperform, but could show isolated stock-specific performance against the broader markets.
NIFTY Services, NIFTY Financial Services, FMCG and the Consumption Indexes are inside the improving quadrant. These groups are expected to show better and resilient performance in the coming days.
Important Note: RRG™ charts show the relative strength and momentum for a group of stocks. In the above Chart, they show relative performance against NIFTY500 Index (Broader Markets) and should not be used directly as buy or sell signals.
Milan Vaishnav, CMT, MSTA
Consulting Technical Analyst
www.EquityResearch.asia | www.ChartWizard.ae
· For Premium Equity Portfolio Advisory on Indian Stocks, Click Here
· Alpha-generating actionable investment ideas on the US and UK Equities Click Here
· For International Commodities like Gold, Crude Oil and EURUSD/GBPUSD pairs Click Here


