In a very strong surge to the up move, the Indian equity markets scaled greater heights, ending on a new lifetime high. In the previous edition of the weekly note, it was mentioned that, looking at the week's options data and the amount of PUT writing that was being done, there was a high possibility that the markets show a strong move on the upside. The NIFTY traded exactly on these analyzed lines and managed to form a new lifetime high. The markets had a strong upward directional bias throughout the week, ending with net gains of 618.40 points (+3.70%) on a weekly basis.
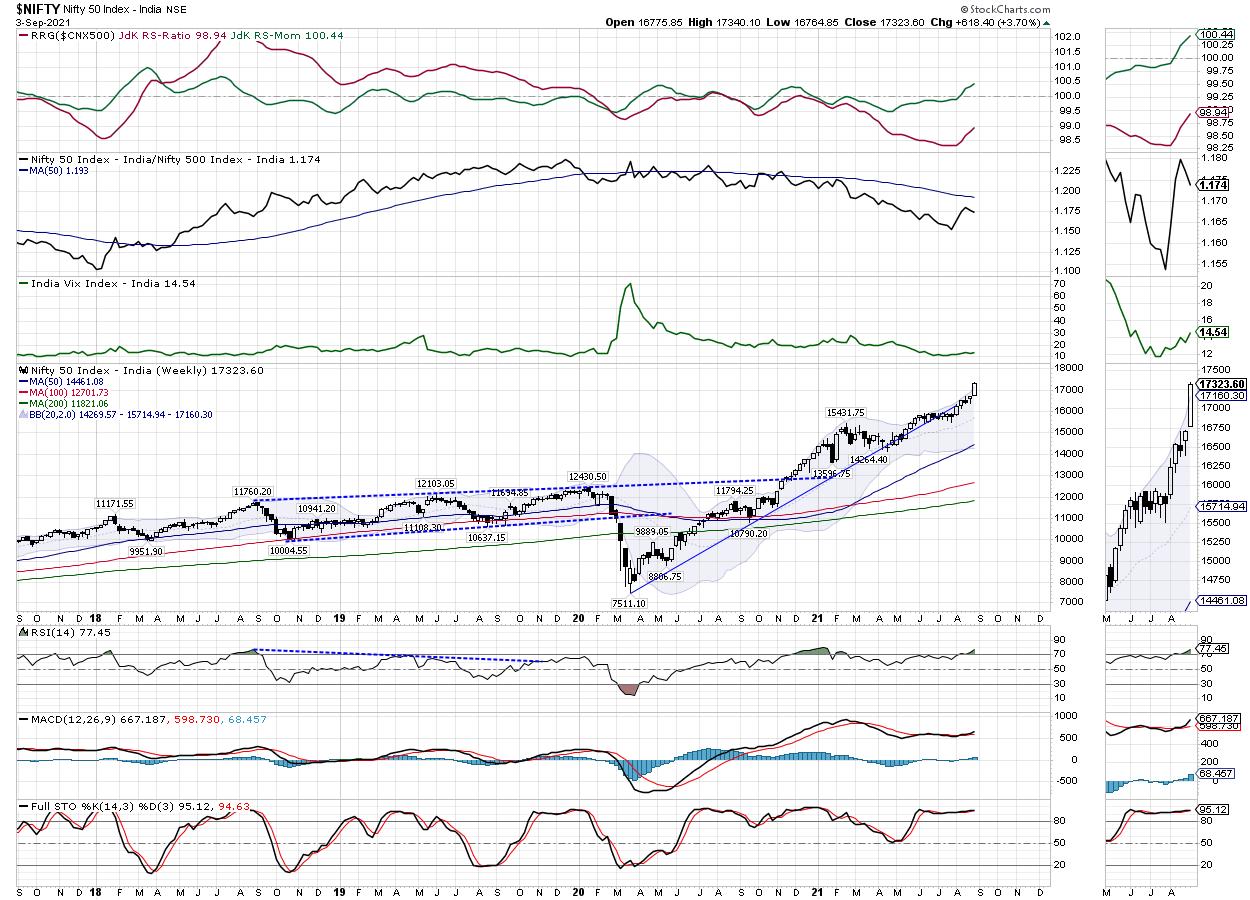
The markets are grossly overbought, as are the NIFTY and the other key indexes excluding BankNifty. However, the options data shows a stronger picture despite the markets being in the overbought territory. The quantum of PUT writing that is done on each incremental up move shows that the supports are being dragged higher and also reflects the confidence of the up move. There are higher chances that the present up-move may see some more room on the upside; however, the overall structure shows that one needs to be cautious and trail their stop losses strictly to avoid getting stuck in the event of any range-bound consolidation at higher levels.
The volatility also increased along with the markets. The INDIAVIX edged up higher by 8.49% to 14.5400. The coming week has stiff resistance at 17500 followed by 17625. Supports come in at 17200 and 17050 levels. Either way, regardless of the trend, the trading range for the markets is likely to stay wider than usual.
The weekly RSI is 77.45; it has marked a new 14-period high, which is bullish. RSI is overbought, but is neutral and does not show any divergence against the price. The daily MACD is bullish and stays above the signal line.
A large white body emerged on the candles. This shows a strong directional consensus on the upside that prevailed during the week. The NIFTY has ended above the upper Bollinger band. Some temporary pullbacks inside the band may occur, but, broadly speaking, there is a higher chance of the current trend persisting for some more time.
The pattern analysis of the weekly chart shows that the main breakout that occurred when the NIFTY moved past the 15900-15950 zone is still very much in force. After each move on the higher side, the markets have consolidated for some time, only to resume their uptrend.
All in all, we see the BankNIFTY and PSU Bank Index continuing to relatively underperform the broader markets. Such behavior is also observed in some of the FMCG and Consumption stocks, despite their indexes showing a strong performance. The coming week will make it necessary to stay with those stocks that have relatively underperformed until now and are showing improvements in their relative strength against the broader markets. A selective and stock-specific approach is advised for the coming week.
Sector Analysis for the Coming Week
In our look at Relative Rotation Graphs®, we compared various sectors against CNX500 (NIFTY 500 Index), which represents over 95% of the free float market cap of all the stocks listed.
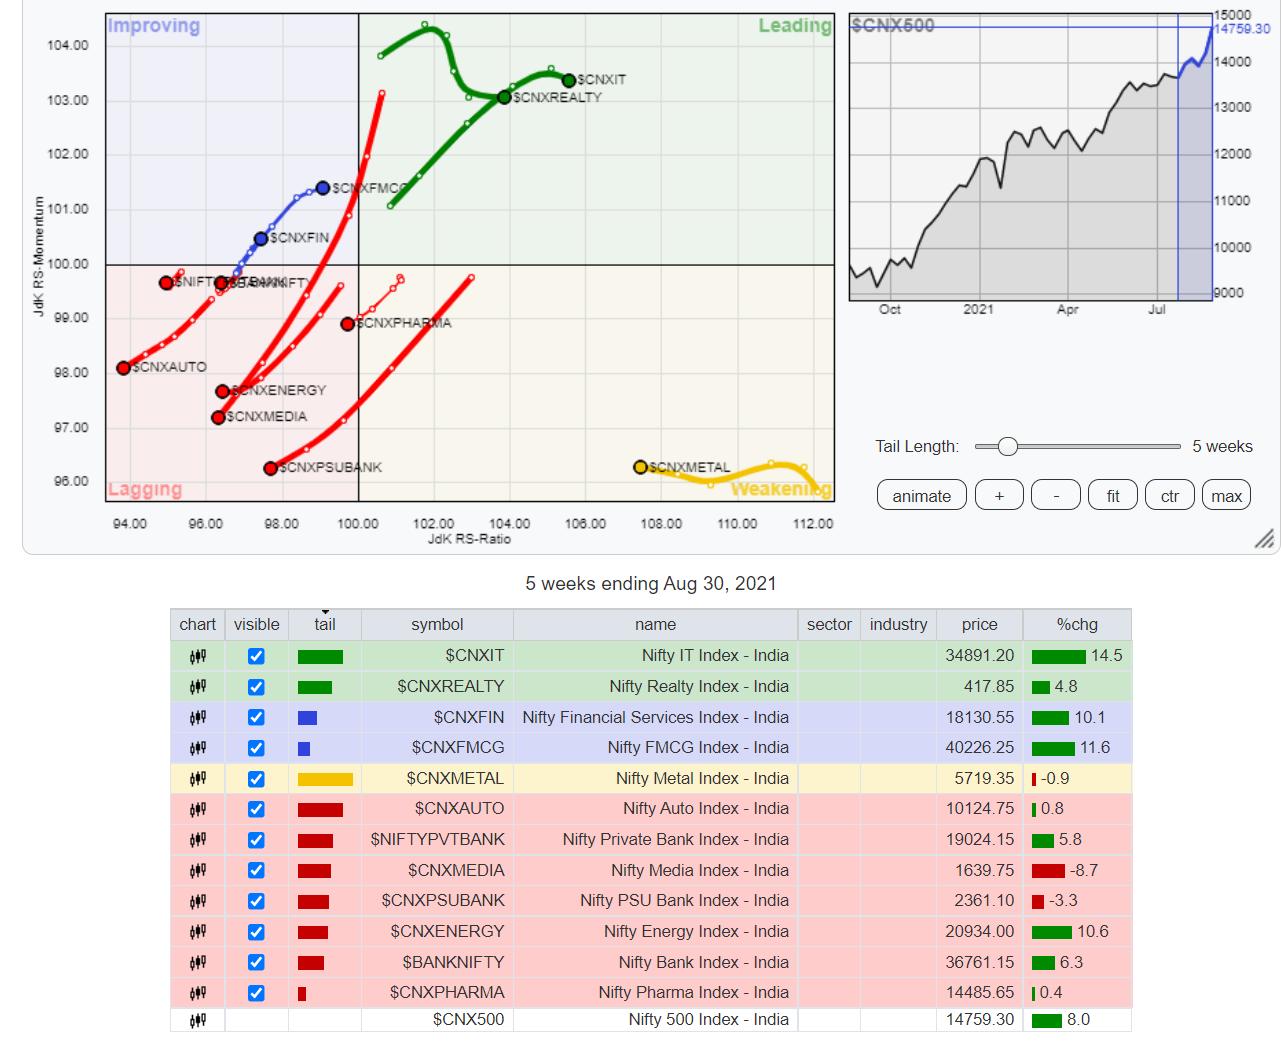
The analysis of Relative Rotation Graphs (RRG) shows the NIFTY IT and Small Cap Indexes inside the leading quadrant. The Realty Index is also inside the leading quadrant and appears to be maintaining its relative momentum against the broader markets. These groups are likely to continue to relatively outperform the broader NIFTY Index.
NIFTY Metal, Midcap and the Commodities Index lay inside the weakening quadrant.
NIFTY Pharma, NIFTY PSE, Auto, Energy, NIFTY Media, and the PSU Bank Indexes languish inside the lagging quadrant. Out of these three, the PSU Bank Index is showing mild signs of improvement in its relative momentum. BankNifty and the NIFTY Infrastructure Index also remain inside the lagging quadrant. However, they appear to be improving their relative momentum for the better and may perform resiliently over the coming days.
FMCG, Consumption and the Services Sector indexes are in the improving quadrant and may continue to better their relative outperformance against the broader markets.
Important Note: RRG™ charts show the relative strength and momentum for a group of stocks. In the above chart, they show relative performance against NIFTY500 Index (Broader Markets) and should not be used directly as buy or sell signals.
Milan Vaishnav, CMT, MSTA
Consulting Technical Analyst
www.EquityResearch.asia | www.ChartWizard.ae
- For Premium Equity Portfolio Advisory on Indian Stocks, Click Here.
- For Alpha-generating actionable investment ideas on the US and UK Equities, Click Here.
- For International Commodities like Gold, Crude Oil and EURUSD/GBPUSD pairs, Click Here.


