In the week before this one, the markets had shown the first signs of some fatigue, as it had ended on a negative note leading to a dark cloud formation on the candles. Over the past five days, the Indian equity market extended its correction; it went on to test and even violate the immediate important support levels to end the week with a cut. The trading range remained much wider; the week saw the index trading in a wide 728.95-point range. While continuing to stay under relentless session pressure, the markets have not shown any signs of any technical pullback. By Friday, the headline index ended with a net loss of 443.25 points (-2.45%) on a weekly basis.
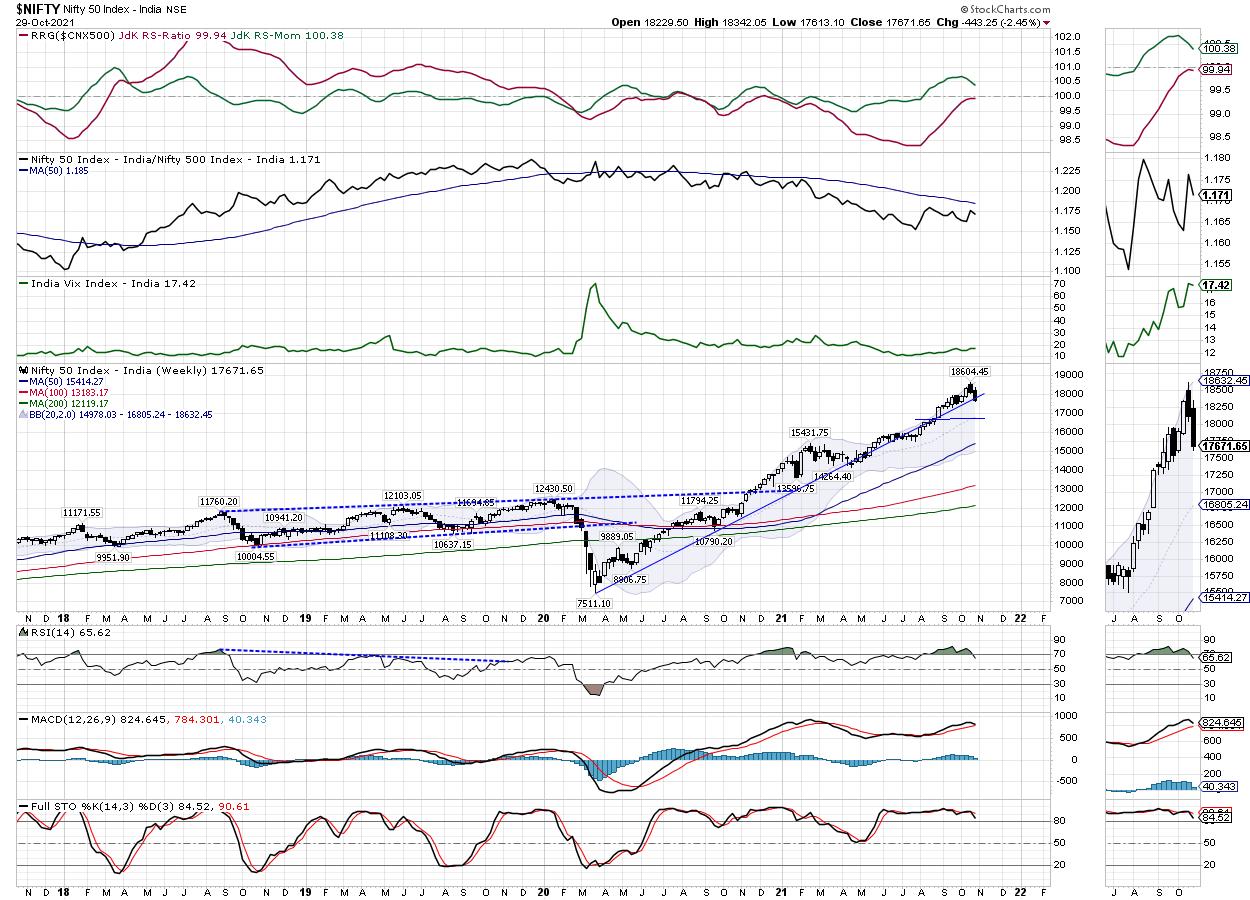
Although there are chances of a technical pullback in the coming week, said week is a very truncated one with practically just three trading days. Thursday will just have a symbolic one-hour Mahurat Trading Session, while Friday will be a trading holiday on account of Diwali-Balipratipada. This will ultimately translate into just a 3-day trading week as the Mahurat session just sees symbolic trades. The NIFTY has tested an important 50-DMA level on the daily chart ,which is presently at 17565. The options data also shows 17500 holding maximum Put OI. However, on the higher side, 18000 has maximum Call OI concentration followed by 17800 levels.
Volatility remained largely unchanged. INDIAVIX declined by just 0.68% to 17.42 on a weekly note. The coming week is likely to see the levels of 17800 and 17890 acting as resistance levels. The supports come in at the 17550 and 17500 levels.
The weekly RSI is 65.62; it has slipped below 70 from the overbought area, which is bearish. It stays neutral and does not show any divergence against the price. The weekly MACD is still bullish and remains above the signal line.
A large black candle emerged. This showed the directional consensus of the market participants that prevailed through the entire week.
The NIFTY has come off nearly 1000 points from its lifetime high. However, even during the declining days, few pockets of the markets, including the broader markets, continued showing great resilience. The markets are due for some technical pullback for two reasons. For one, it has seen a near-vertical corrective move of 1000 points from the levels of 18600; secondly, Friday's session has added a large number of shorts being added to the system. NIFTY November futures have added over 3.31 lakh shares or 3.18% in net Open Interest. We recommend staying light on leveraged exposures, avoiding shorts, and using downsides, if any, to make modest purchases.
Sector Analysis for the Coming Week
In our look at Relative Rotation Graphs®, we compared various sectors against CNX500 (NIFTY 500 Index), which represents over 95% of the free float market cap of all the stocks listed.
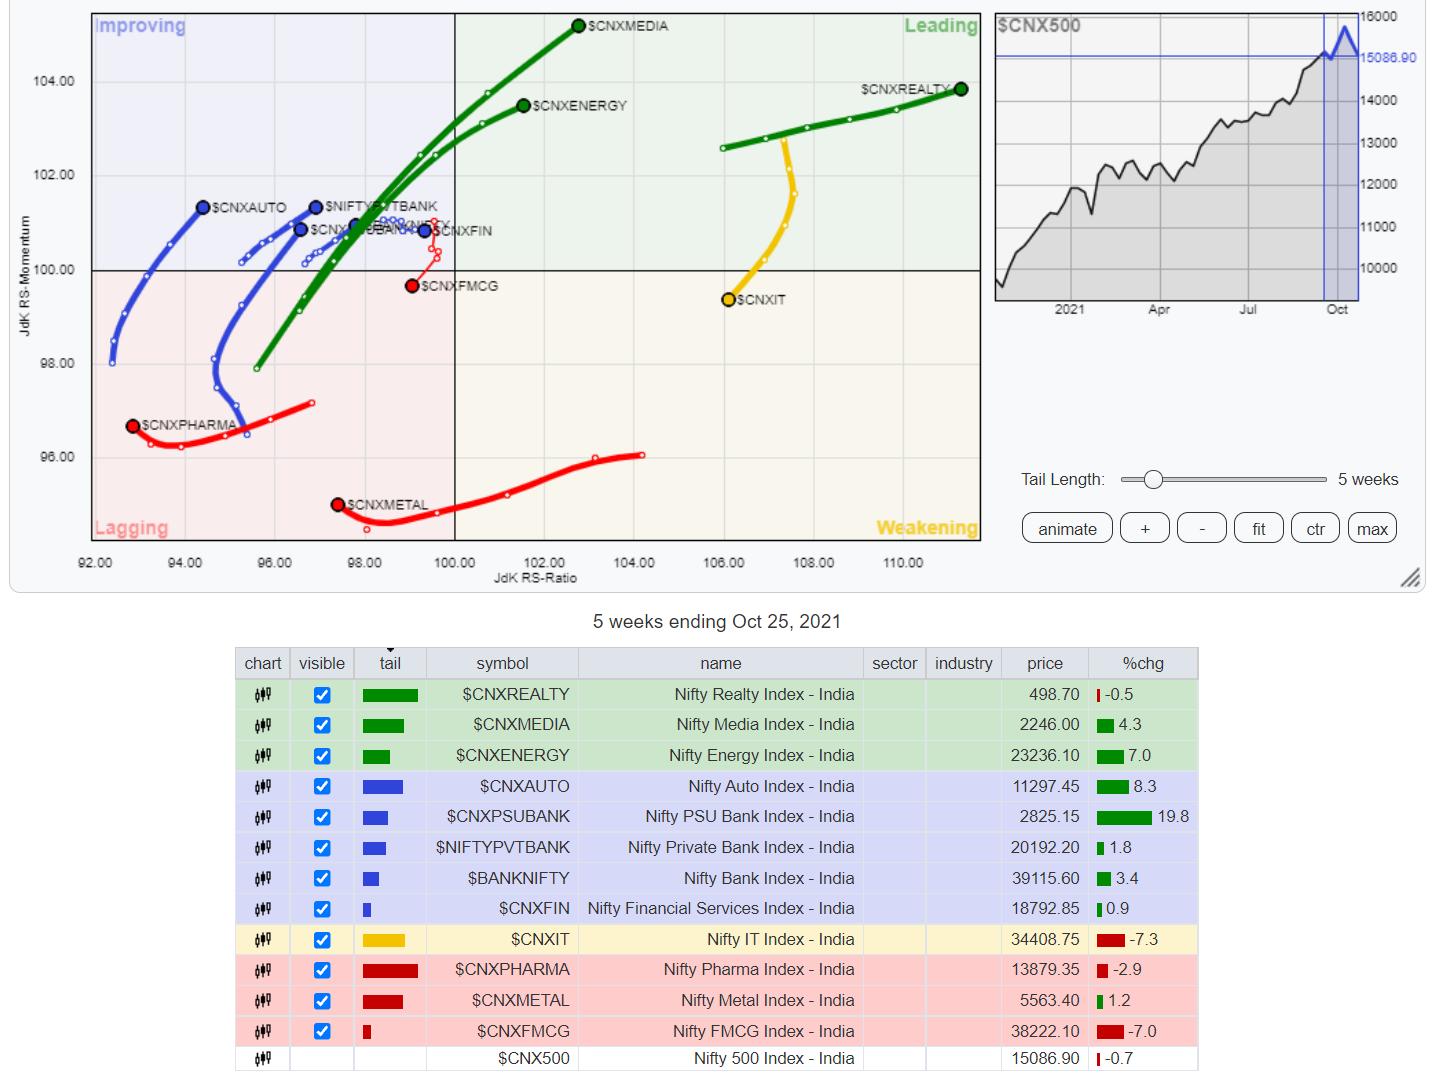
The analysis of Relative Rotation Graphs (RRG) shows a likely end of relative outperformance from the IT Index. The NIFTY IT Index has slipped inside the weakening quadrant; its relative outperformance may well take a breather over the coming weeks. The NIFTY Midcap Index, which is also inside the weakening quadrant, is seen continuing to sharply improve its relative momentum against the broader markets; it is seen moving towards the leading quadrant.
The Energy Index, Media, Realty Index, Consumption, Services Sector and Infrastructure Indexes are inside the leading quadrant. The PSE Index has also rolled inside the leading quadrant. All these groups may relatively outperform the broader markets.
Both the NIFTY Metal and Pharma Index, which are inside the lagging quadrant, are seen trying to consolidate and improve their relative momentum along with NIFTY Commodities.
NIFTY Auto, Financial Services, Banknifty and the PSU Bank Index are inside the Improving quadrant. These groups too are likely to put up a resilient show against the broader markets.
Important Note: RRG™ charts show the relative strength and momentum for a group of stocks. In the above Chart, they show relative performance against NIFTY500 Index (Broader Markets) and should not be used directly as buy or sell signals.
Milan Vaishnav, CMT, MSTA
Consulting Technical Analyst
- www.EquityResearch.asia | www.ChartWizard.ae
- For Premium Equity Portfolio Advisory on Indian Stocks, Click Here.
- Alpha-generating actionable investment ideas on the US and UK Equities, Click Here.
- For International Commodities like Gold, Crude Oil and EURUSD/GBPUSD pairs, Click Here.


