In a three-day trading week truncated by festivities, the Indian equity markets attempted to stabilize on the expected lines. The market rebounded from near the 50-DMA levels and also took support on an 18-month long upward rising trend line on the weekly charts. The NIFTY stayed in a narrower 315-point range as it closed near the crucial resistance point of 18000 levels. During the week, the NIFTY reacted to the FOMC outcome, where it mostly digested the tapering of the bond purchases by the Fed which was largely discounted by the markets. The NIFTY ended with a net gain of 245.15 points (+1.39%) on a weekly basis.
The global markets have largely digested what was a taper-without-tantrum and have inched higher. The Indian markets will open on Monday following two days of holidays, as Thursday just had a token one-hour Mahurat trading session. The open on Monday will largely adjust to Friday's global trade setup, which has been steady and buoyant. For the NIFTY to resume its up move, it will be crucial moving past the 18000 levels. The weekly options data show a higher likelihood of the NIFTY moving past this point. Unless this happens, we will continue to see the markets consolidating in a broad range.
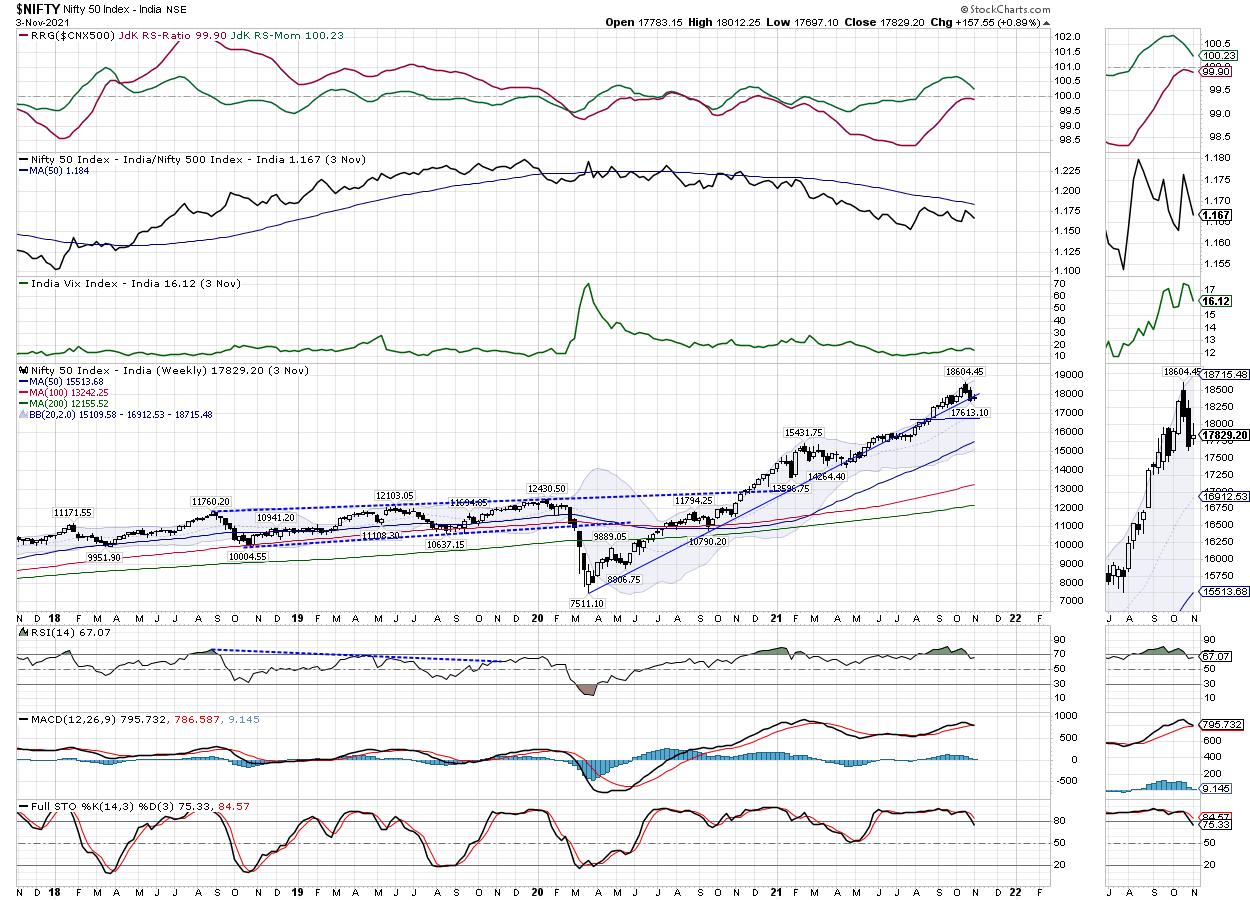
Volatility came down over the previous sessions; INDIAVIX came off by 9.63% to 15.75. The coming week is expected to see the levels of 18000 and 18265 to offer resistance to the markets. The supports will come in at the 17865 and 17680 levels.
The weekly RSI is 67.82; it is neutral and does not show any divergence against the price. The weekly MACD is bullish and remains above the signal line. A small white body, which can also be termed as a Bullish Harami, occurred. We can also term this formation as an "Inside Bar" on the bar charts. This results in a lower top and a higher bottom on the charts. From the technical perspective, it lays the stage for an up move if the high of the previous candle is taken out.
The pattern analysis shows that the NIFTY has modestly violated the support of the rising trend line pattern; this trend line is drawn from the lows of March 2020 that joined subsequent higher bottoms. The previous week has seen the markets move higher above this trend line once again; this would mean restoration of this upward rising trend line as immediate support for the markets.
All in all, there is the possibility of the broader markets starting to outperform again. We can expect to see the Midcaps start their relative outperformance. Apart from that, the PSE stocks, banks, auto, Realty and pockets of Pharma stocks can do well. We recommend avoiding shorting the markets even if some downsides are seen and if any incremental consolidation happens. There are no signs on the technical charts as yet that suggest any serious weakness or any downsides. All downside moves, if at all they happen, should be used to make selective purchases. While overall leveraged exposures should be kept limited and modest, a selective and cautiously positive approach is advised for the week.
Sector Analysis for the Coming Week
In our look at Relative Rotation Graphs®, we compare various sectors against CNX500 (NIFTY 500 Index), which represents over 95% of the free float market cap of all the stocks listed.
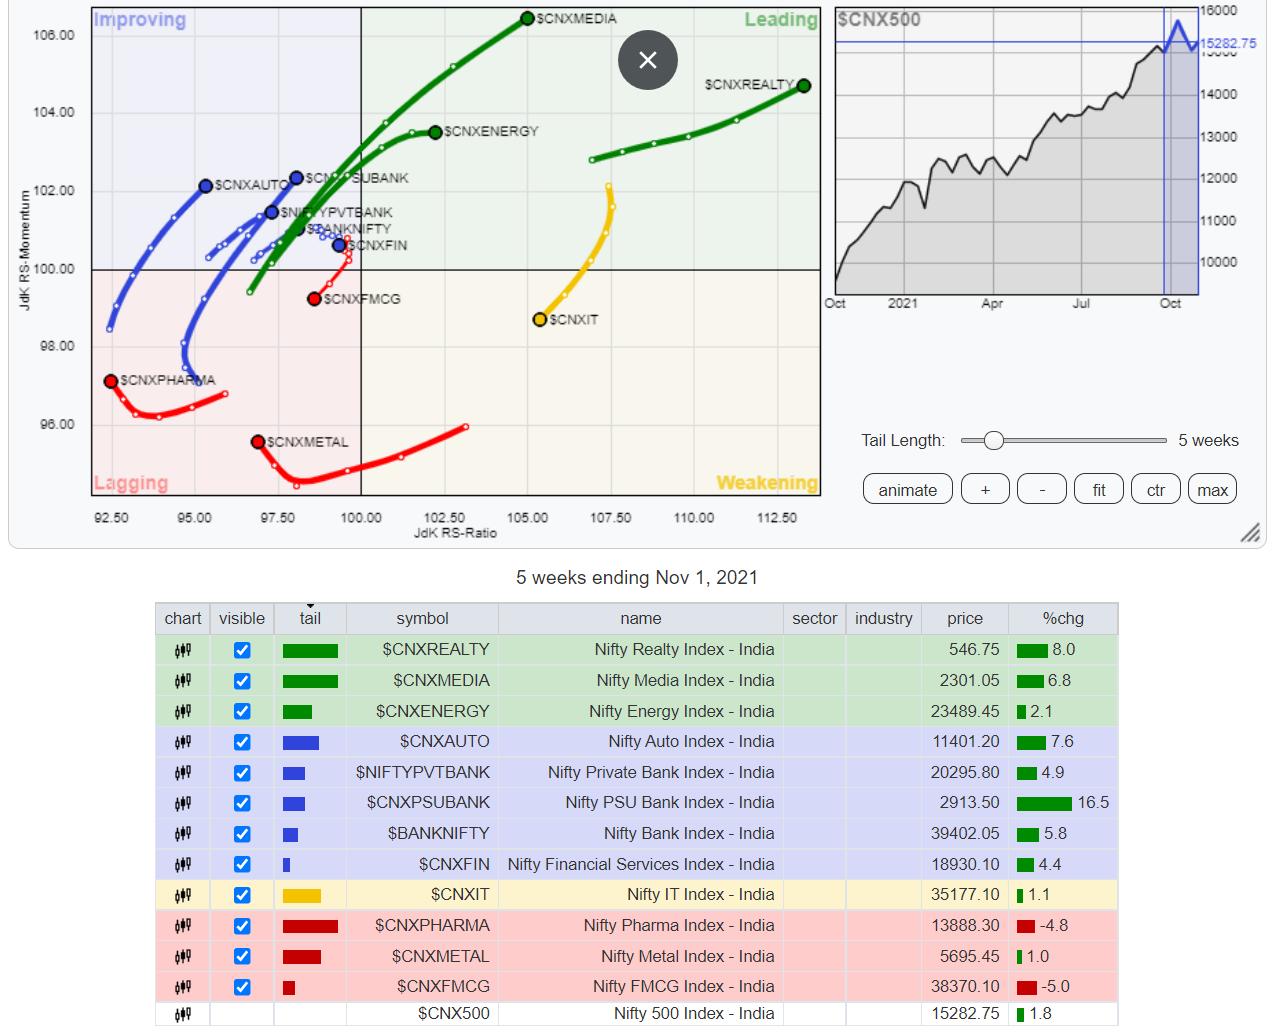
The analysis of Relative Rotation Graphs (RRG) shows Media, Realty, Energy & Infrastructure and PSE Indexes are inside the leading quadrant. They are likely to relatively outperform the broader markets. The MidCap 100 index has also rolled inside the leading quadrant from the weakening quadrant. This is likely to reinitiate the relative outperformance of the broader markets against the front-line NIFTY.
The NIFTY IT Index is inside the weakening quadrant. It is likely to offer subtle performance against the broader markets.
NIFTY FMCG is seen languishing inside the lagging quadrant. NIFTY Metal, Pharma, and Commodities are inside the lagging quadrant as well; they are seen improving on their relative momentum against the broader NIFTY500 Index.
BankNifty, the PSU Bank Index and Auto remain strongly placed inside the improving quadrant. The financial services index is also inside the improving quadrant. These groups may put up a resilient show against the broader markets.
Important Note: RRG™ charts show the relative strength and momentum for a group of stocks. In the above Chart, they show relative performance against NIFTY500 Index (Broader Markets) and should not be used directly as buy or sell signals.
Milan Vaishnav, CMT, MSTA
Consulting Technical Analyst
www.EquityResearch.asia | www.ChartWizard.ae
- For Premium Equity Portfolio Advisory on Indian Stocks, Click Here.
- Alpha-generating actionable investment ideas on the US and UK Equities, Click Here.
- For International Commodities like Gold, Crude Oil and EURUSD/GBPUSD pairs, Click Here.


